Climate Change Chart of Powder Mountain, USA
Comprehensive Climate Change Chart of Powder Mountain, USA: Monthly Averages and Impact Trends
Exploring the changing climate patterns in Powder Mountain, USA reveals significant shifts in temperature, rainfall, snowfall, and sunshine duration over the years.
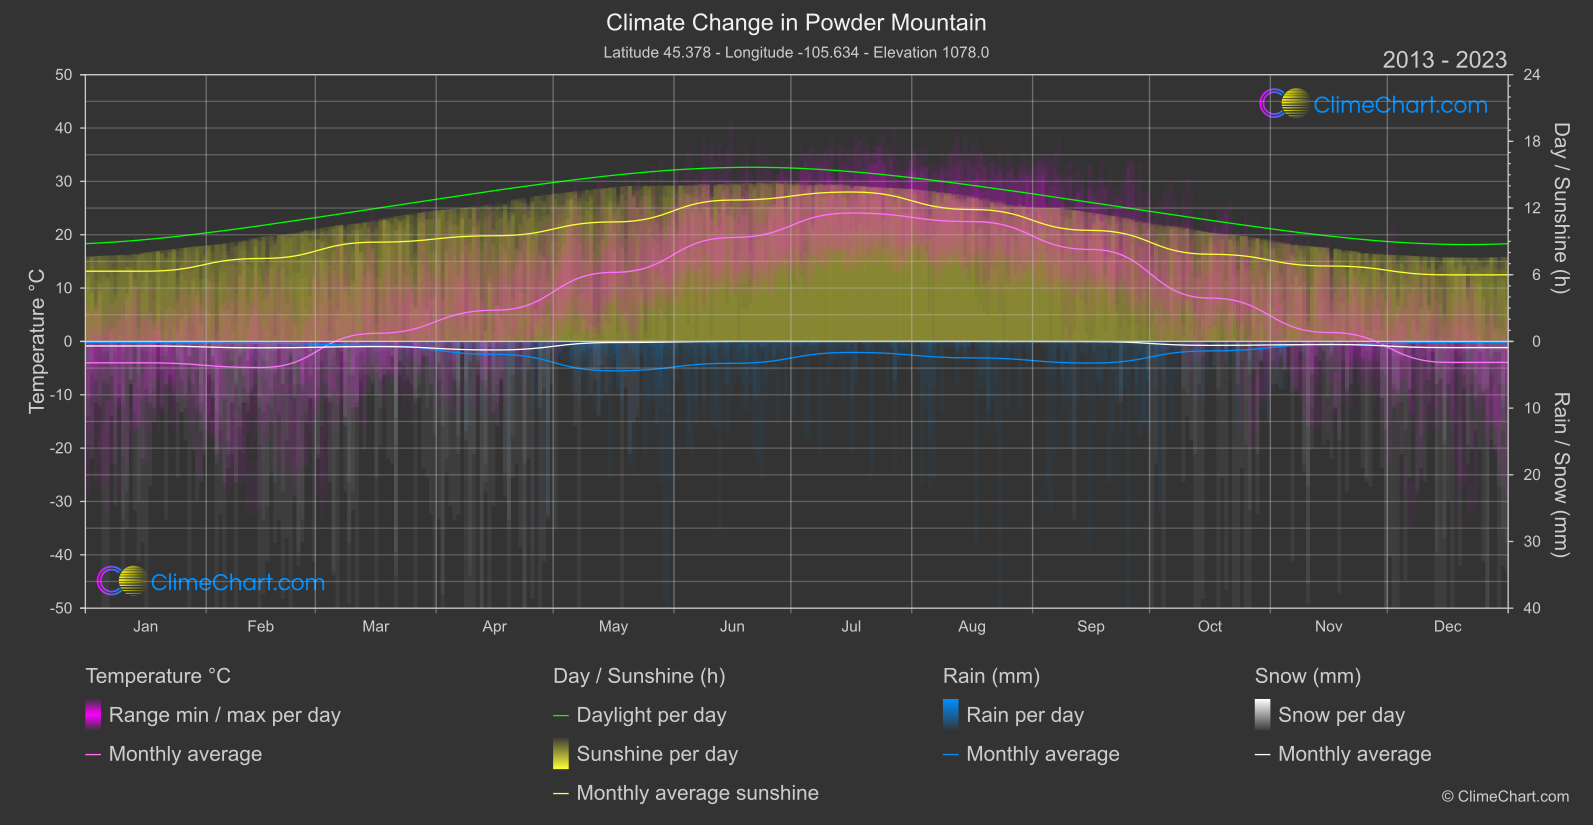
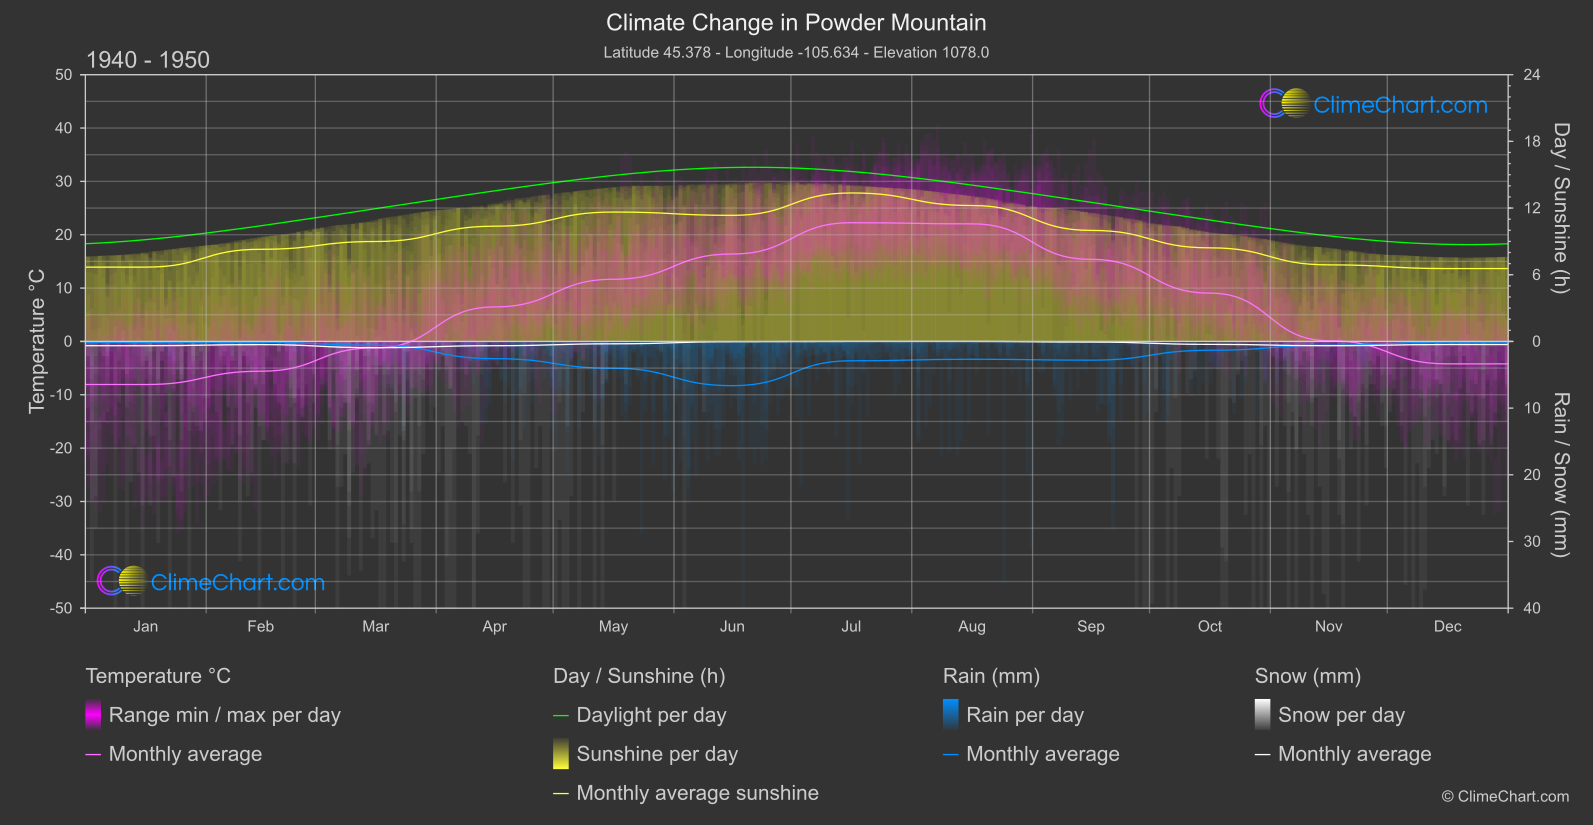
Powder Mountain in the USA has experienced notable changes in climate and weather conditions over the years. The data comparison between 1940-1950 and 2013-2024 reveals varying trends across different months. For instance, June shows a temperature increase of 3.08°C and a significant decrease in snowfall, while September has seen an increase in rainfall by 0.22mm. These insights provide valuable information on the evolving climate patterns in Powder Mountain.
Climate Change Data Overview for Powder Mountain, USA
Explore the comprehensive climate change data for Powder Mountain, USA. This detailed table provides valuable insights into temperature variations, precipitation levels, and seasonal changes influenced by climate change, helping you understand the unique weather patterns of this region.
Temperature °C
| Month | ⌀ 1940 - 1950 | ⌀ 2013 - 2023 | +/- |
|---|---|---|---|
| Jan | -8.08 | -4.00 | 4.07 |
| Feb | -5.58 | -4.90 | 0.69 |
| Mar | -1.19 | 1.51 | 2.70 |
| Apr | 6.47 | 5.85 | -0.62 |
| May | 11.65 | 12.95 | 1.29 |
| Jun | 16.39 | 19.48 | 3.08 |
| Jul | 22.26 | 24.07 | 1.81 |
| Aug | 22.04 | 22.46 | 0.43 |
| Sep | 15.39 | 17.24 | 1.85 |
| Oct | 9.06 | 8.12 | -0.94 |
| Nov | 0.13 | 1.68 | 1.55 |
| Dec | -4.21 | -3.93 | 0.28 |
| ⌀ Month | 7.03 | 8.38 | 1.35 |
Sunshine (h)
| Month | ⌀ 1940 - 1950 | ⌀ 2013 - 2023 | +/- |
|---|---|---|---|
| Jan | 6.69 | 6.32 | -0.37 |
| Feb | 8.29 | 7.46 | -0.83 |
| Mar | 8.99 | 8.93 | -0.06 |
| Apr | 10.37 | 9.51 | -0.86 |
| May | 11.64 | 10.75 | -0.89 |
| Jun | 11.35 | 12.72 | 1.38 |
| Jul | 13.36 | 13.44 | 0.08 |
| Aug | 12.23 | 11.87 | -0.36 |
| Sep | 9.99 | 9.99 | 0.00 |
| Oct | 8.42 | 7.84 | -0.58 |
| Nov | 6.89 | 6.78 | -0.11 |
| Dec | 6.56 | 5.99 | -0.56 |
| ⌀ Month | 9.56 | 9.30 | -0.26 |
Rain (mm)
| Month | ⌀ 1940 - 1950 | ⌀ 2013 - 2023 | +/- |
|---|---|---|---|
| Jan | 0.07 | 0.08 | 0.01 |
| Feb | 0.06 | 0.14 | 0.08 |
| Mar | 0.29 | 0.29 | 0.01 |
| Apr | 1.29 | 0.97 | -0.33 |
| May | 2.01 | 2.21 | 0.20 |
| Jun | 3.32 | 1.64 | -1.68 |
| Jul | 1.45 | 0.82 | -0.63 |
| Aug | 1.34 | 1.23 | -0.10 |
| Sep | 1.40 | 1.62 | 0.22 |
| Oct | 0.66 | 0.71 | 0.05 |
| Nov | 0.28 | 0.22 | -0.06 |
| Dec | 0.05 | 0.07 | 0.02 |
| ⌀ Month | 1.02 | 0.83 | -0.18 |
Snow (mm)
| Month | ⌀ 1940 - 1950 | ⌀ 2013 - 2023 | +/- |
|---|---|---|---|
| Jan | 0.32 | 0.34 | 0.02 |
| Feb | 0.24 | 0.48 | 0.24 |
| Mar | 0.47 | 0.38 | -0.08 |
| Apr | 0.32 | 0.64 | 0.32 |
| May | 0.18 | 0.08 | -0.10 |
| Jun | 0.02 | 0.00 | -0.02 |
| Jul | 0.00 | 0.00 | 0.00 |
| Aug | 0.00 | 0.00 | 0.00 |
| Sep | 0.05 | 0.01 | -0.04 |
| Oct | 0.22 | 0.29 | 0.08 |
| Nov | 0.32 | 0.23 | -0.09 |
| Dec | 0.23 | 0.46 | 0.23 |
| ⌀ Month | 0.20 | 0.24 | 0.05 |