Climate Change Chart of Nanjing, China
Comprehensive Climate Change Chart of Nanjing, China: Monthly Averages and Impact Trends
Explore the changing climate in Nanjing, China with detailed insights on temperature, rainfall, snowfall, and sunshine duration comparing data from 1940 - 1950 to 2013 - 2024.
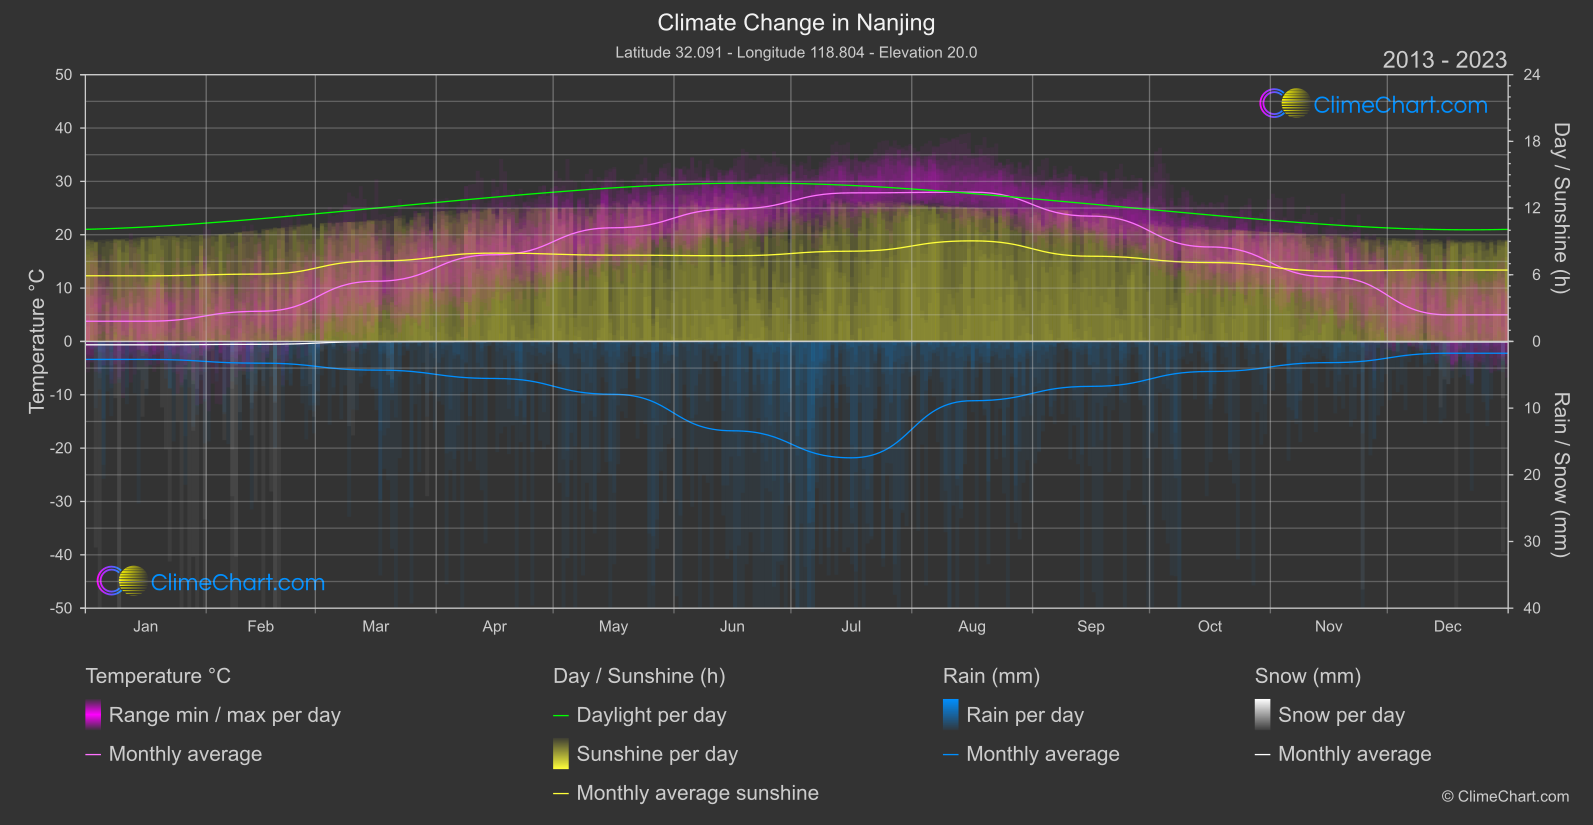
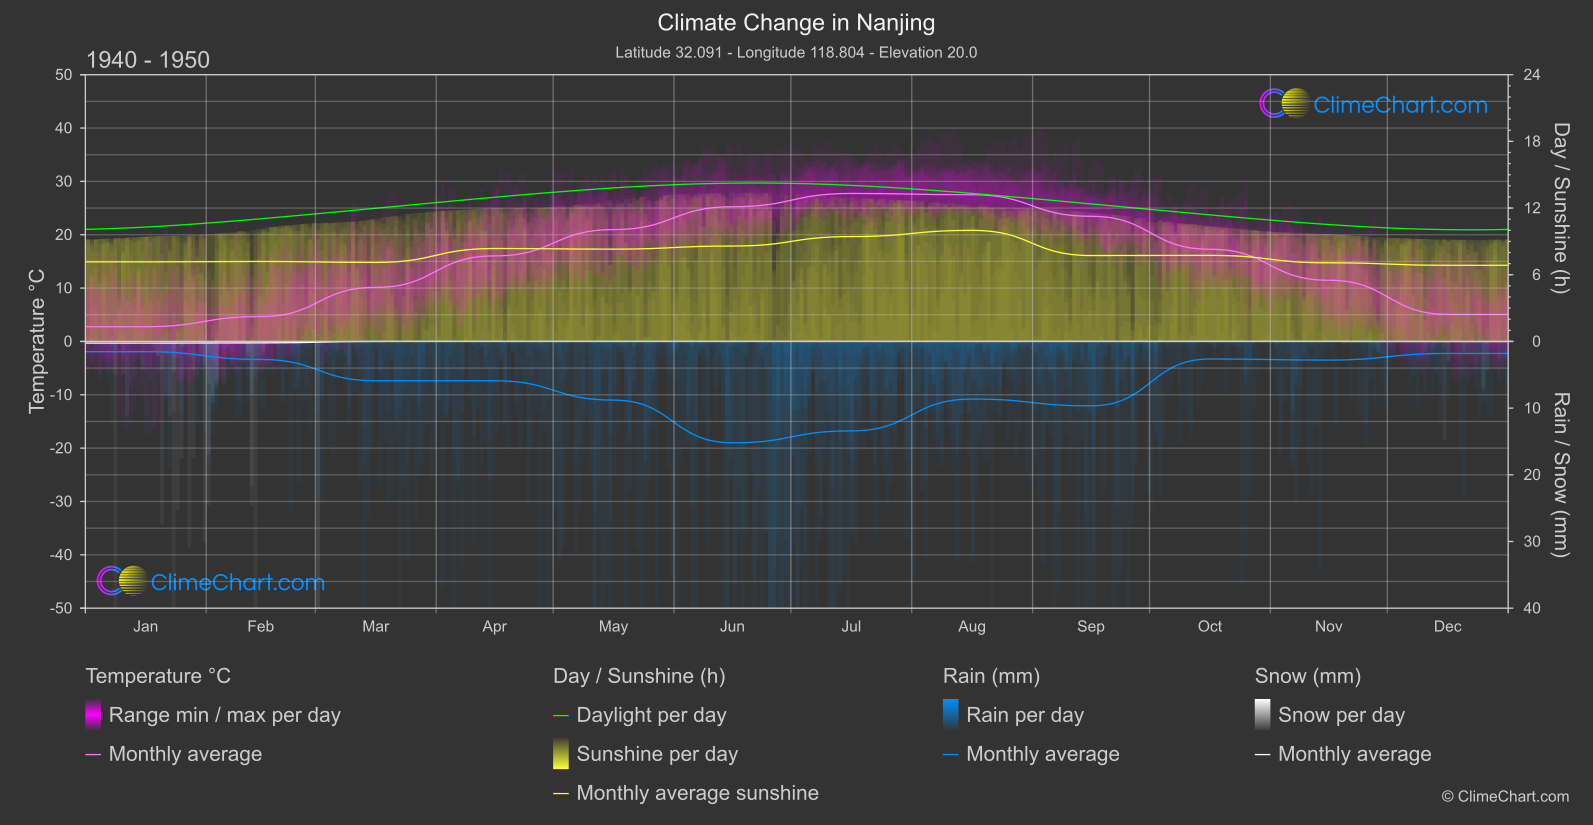
Nanjing, China, experiences significant changes in climate parameters over the years. Looking at the data, we can see that the month with the highest temperature change is March, with a difference of 1.159°C between 1940 - 1950 and 2013 - 2024. On the other hand, the month with the highest rainfall change is July, showing an increase of 2.02mm. Snowfall remains minimal throughout the years, with slight variations. Sunshine duration also fluctuates, with the biggest change observed in July, where there is a decrease of 1.31 hours of sunshine.
Climate Change Data Overview for Nanjing, China
Explore the comprehensive climate change data for Nanjing, China. This detailed table provides valuable insights into temperature variations, precipitation levels, and seasonal changes influenced by climate change, helping you understand the unique weather patterns of this region.
Temperature °C
| Month | ⌀ 1940 - 1950 | ⌀ 2013 - 2023 | +/- |
|---|---|---|---|
| Jan | 2.76 | 3.79 | 1.02 |
| Feb | 4.66 | 5.65 | 1.00 |
| Mar | 10.13 | 11.29 | 1.16 |
| Apr | 16.03 | 16.25 | 0.22 |
| May | 20.96 | 21.30 | 0.34 |
| Jun | 25.25 | 24.83 | -0.42 |
| Jul | 27.74 | 27.85 | 0.11 |
| Aug | 27.50 | 27.98 | 0.48 |
| Sep | 23.45 | 23.49 | 0.04 |
| Oct | 17.28 | 17.71 | 0.43 |
| Nov | 11.46 | 12.12 | 0.65 |
| Dec | 5.07 | 4.99 | -0.09 |
| ⌀ Month | 16.03 | 16.44 | 0.41 |
Sunshine (h)
| Month | ⌀ 1940 - 1950 | ⌀ 2013 - 2023 | +/- |
|---|---|---|---|
| Jan | 7.16 | 5.91 | -1.25 |
| Feb | 7.19 | 6.06 | -1.14 |
| Mar | 7.11 | 7.24 | 0.13 |
| Apr | 8.36 | 7.95 | -0.41 |
| May | 8.31 | 7.76 | -0.54 |
| Jun | 8.58 | 7.71 | -0.87 |
| Jul | 9.43 | 8.12 | -1.31 |
| Aug | 9.99 | 9.05 | -0.95 |
| Sep | 7.73 | 7.67 | -0.06 |
| Oct | 7.74 | 7.10 | -0.65 |
| Nov | 7.07 | 6.35 | -0.72 |
| Dec | 6.85 | 6.42 | -0.43 |
| ⌀ Month | 7.96 | 7.28 | -0.68 |
Rain (mm)
| Month | ⌀ 1940 - 1950 | ⌀ 2013 - 2023 | +/- |
|---|---|---|---|
| Jan | 0.77 | 1.35 | 0.58 |
| Feb | 1.35 | 1.63 | 0.28 |
| Mar | 2.95 | 2.15 | -0.80 |
| Apr | 2.95 | 2.78 | -0.17 |
| May | 4.40 | 3.97 | -0.43 |
| Jun | 7.60 | 6.70 | -0.90 |
| Jul | 6.71 | 8.73 | 2.02 |
| Aug | 4.32 | 4.45 | 0.13 |
| Sep | 4.83 | 3.37 | -1.46 |
| Oct | 1.32 | 2.25 | 0.93 |
| Nov | 1.40 | 1.59 | 0.19 |
| Dec | 0.90 | 0.88 | -0.02 |
| ⌀ Month | 3.29 | 3.32 | 0.03 |
Snow (mm)
| Month | ⌀ 1940 - 1950 | ⌀ 2013 - 2023 | +/- |
|---|---|---|---|
| Jan | 0.13 | 0.25 | 0.13 |
| Feb | 0.11 | 0.22 | 0.11 |
| Mar | 0.00 | 0.02 | 0.02 |
| Apr | 0.00 | 0.00 | 0.00 |
| May | 0.00 | 0.00 | 0.00 |
| Jun | 0.00 | 0.00 | 0.00 |
| Jul | 0.00 | 0.00 | 0.00 |
| Aug | 0.00 | 0.00 | 0.00 |
| Sep | 0.00 | 0.00 | 0.00 |
| Oct | 0.00 | 0.00 | 0.00 |
| Nov | 0.00 | 0.01 | 0.01 |
| Dec | 0.01 | 0.04 | 0.03 |
| ⌀ Month | 0.02 | 0.04 | 0.02 |