Climate Change Chart of Madison, USA
Comprehensive Climate Change Chart of Madison, USA: Monthly Averages and Impact Trends
Explore the changing climate in Madison, USA with insights from temperature, rainfall, snowfall, and sunshine duration data. Discover how the climate has evolved from 1940 to 1950 compared to 2013 to 2024.
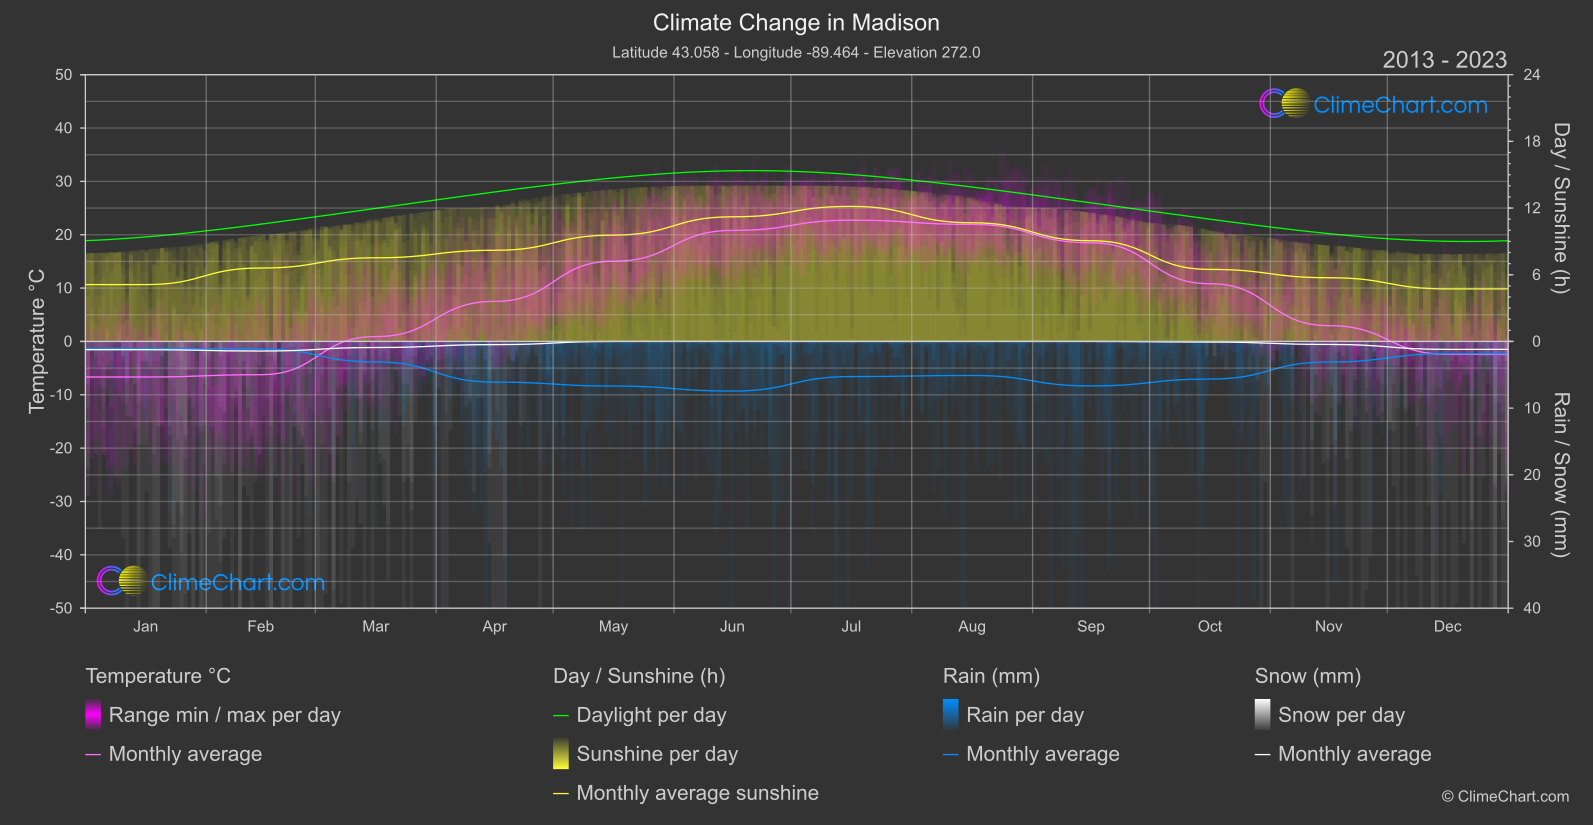
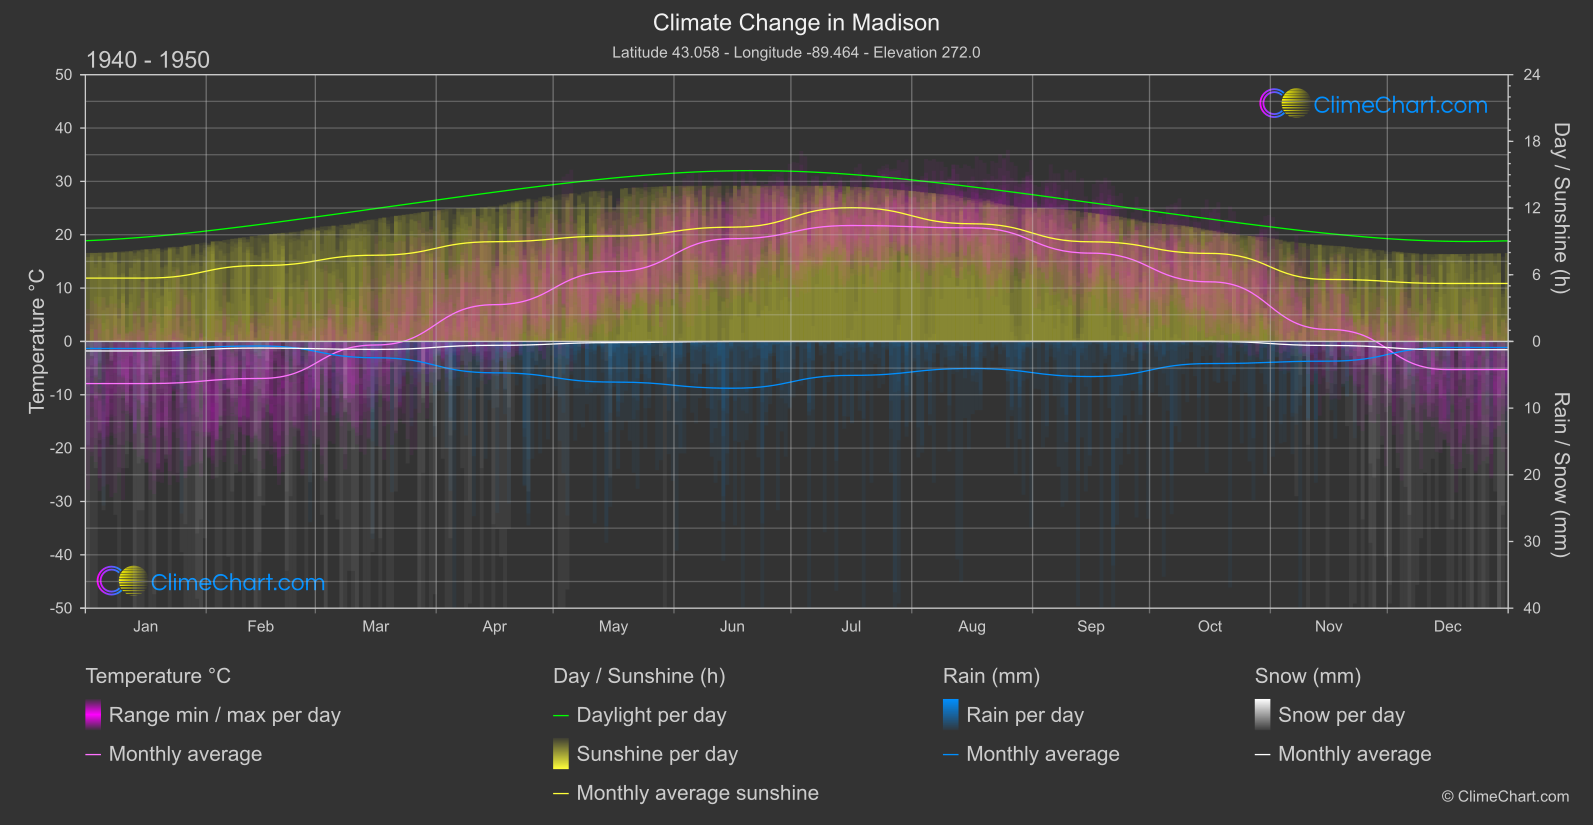
Madison, USA experiences varying climate conditions with notable changes in temperature, rainfall, snowfall, and sunshine duration over the years. From the data provided, it is evident that certain months have seen significant shifts in weather patterns. For instance, the month of December shows a substantial increase in temperature from 1940 to 1950 compared to 2013 to 2024, indicating a warming trend. On the other hand, the month of October exhibits a significant rise in rainfall, reflecting changing precipitation patterns. These insights highlight the dynamic nature of climate change in Madison, USA.
Climate Change Data Overview for Madison, USA
Explore the comprehensive climate change data for Madison, USA. This detailed table provides valuable insights into temperature variations, precipitation levels, and seasonal changes influenced by climate change, helping you understand the unique weather patterns of this region.
Temperature °C
| Month | ⌀ 1940 - 1950 | ⌀ 2013 - 2023 | +/- |
|---|---|---|---|
| Jan | -7.90 | -6.67 | 1.23 |
| Feb | -6.94 | -6.24 | 0.70 |
| Mar | -0.67 | 0.91 | 1.57 |
| Apr | 6.89 | 7.50 | 0.61 |
| May | 13.11 | 15.04 | 1.93 |
| Jun | 19.25 | 20.80 | 1.55 |
| Jul | 21.73 | 22.73 | 1.00 |
| Aug | 21.29 | 21.94 | 0.65 |
| Sep | 16.55 | 18.49 | 1.94 |
| Oct | 11.17 | 10.82 | -0.36 |
| Nov | 2.25 | 2.96 | 0.71 |
| Dec | -5.27 | -2.41 | 2.86 |
| ⌀ Month | 7.62 | 8.82 | 1.20 |
Sunshine (h)
| Month | ⌀ 1940 - 1950 | ⌀ 2013 - 2023 | +/- |
|---|---|---|---|
| Jan | 5.70 | 5.11 | -0.59 |
| Feb | 6.83 | 6.60 | -0.22 |
| Mar | 7.76 | 7.53 | -0.23 |
| Apr | 8.97 | 8.20 | -0.77 |
| May | 9.49 | 9.57 | 0.08 |
| Jun | 10.28 | 11.21 | 0.93 |
| Jul | 12.04 | 12.15 | 0.11 |
| Aug | 10.59 | 10.67 | 0.09 |
| Sep | 8.96 | 9.06 | 0.09 |
| Oct | 7.92 | 6.48 | -1.44 |
| Nov | 5.58 | 5.73 | 0.15 |
| Dec | 5.22 | 4.72 | -0.49 |
| ⌀ Month | 8.28 | 8.09 | -0.19 |
Rain (mm)
| Month | ⌀ 1940 - 1950 | ⌀ 2013 - 2023 | +/- |
|---|---|---|---|
| Jan | 0.53 | 0.52 | -0.00 |
| Feb | 0.34 | 0.56 | 0.22 |
| Mar | 1.22 | 1.54 | 0.31 |
| Apr | 2.35 | 3.05 | 0.70 |
| May | 3.05 | 3.35 | 0.30 |
| Jun | 3.51 | 3.72 | 0.21 |
| Jul | 2.54 | 2.63 | 0.09 |
| Aug | 2.03 | 2.55 | 0.52 |
| Sep | 2.63 | 3.33 | 0.70 |
| Oct | 1.66 | 2.82 | 1.16 |
| Nov | 1.48 | 1.54 | 0.06 |
| Dec | 0.45 | 0.92 | 0.46 |
| ⌀ Month | 1.82 | 2.21 | 0.39 |
Snow (mm)
| Month | ⌀ 1940 - 1950 | ⌀ 2013 - 2023 | +/- |
|---|---|---|---|
| Jan | 0.71 | 0.62 | -0.10 |
| Feb | 0.50 | 0.72 | 0.22 |
| Mar | 0.60 | 0.46 | -0.14 |
| Apr | 0.29 | 0.24 | -0.05 |
| May | 0.09 | 0.00 | -0.09 |
| Jun | 0.00 | 0.00 | 0.00 |
| Jul | 0.00 | 0.00 | 0.00 |
| Aug | 0.00 | 0.00 | 0.00 |
| Sep | 0.00 | 0.00 | -0.00 |
| Oct | 0.00 | 0.05 | 0.05 |
| Nov | 0.30 | 0.22 | -0.08 |
| Dec | 0.62 | 0.59 | -0.03 |
| ⌀ Month | 0.26 | 0.24 | -0.02 |