Climate Change Chart of Lech Zürs, Austria
Comprehensive Climate Change Chart of Lech Zürs, Austria: Monthly Averages and Impact Trends
Explore the changing climate in Lech Zürs, Austria with insightful data analysis. Discover the trends in temperature, rainfall, snowfall, and sunshine duration over the years.
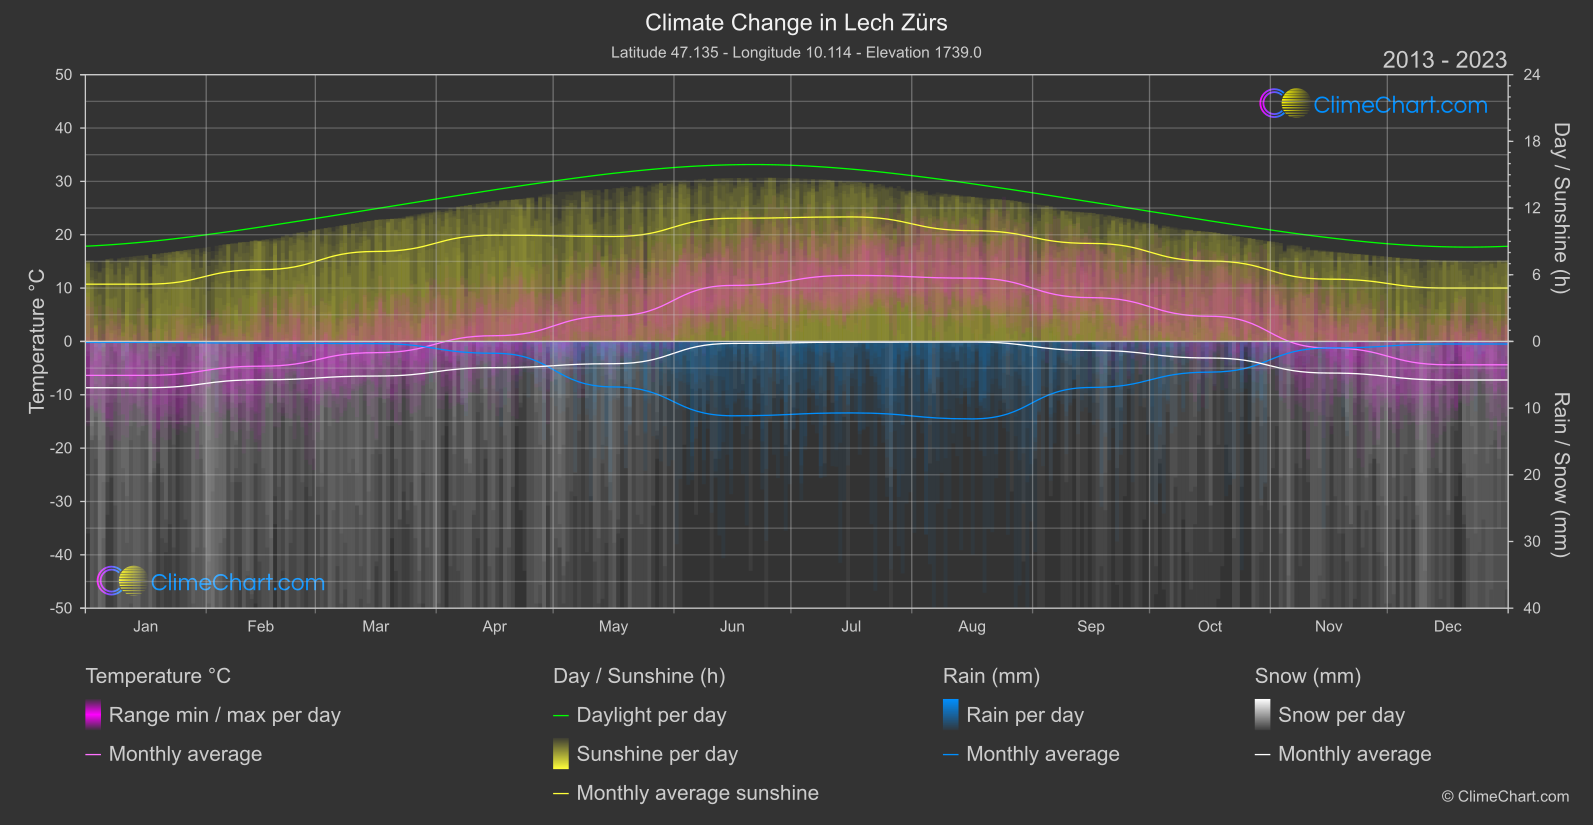
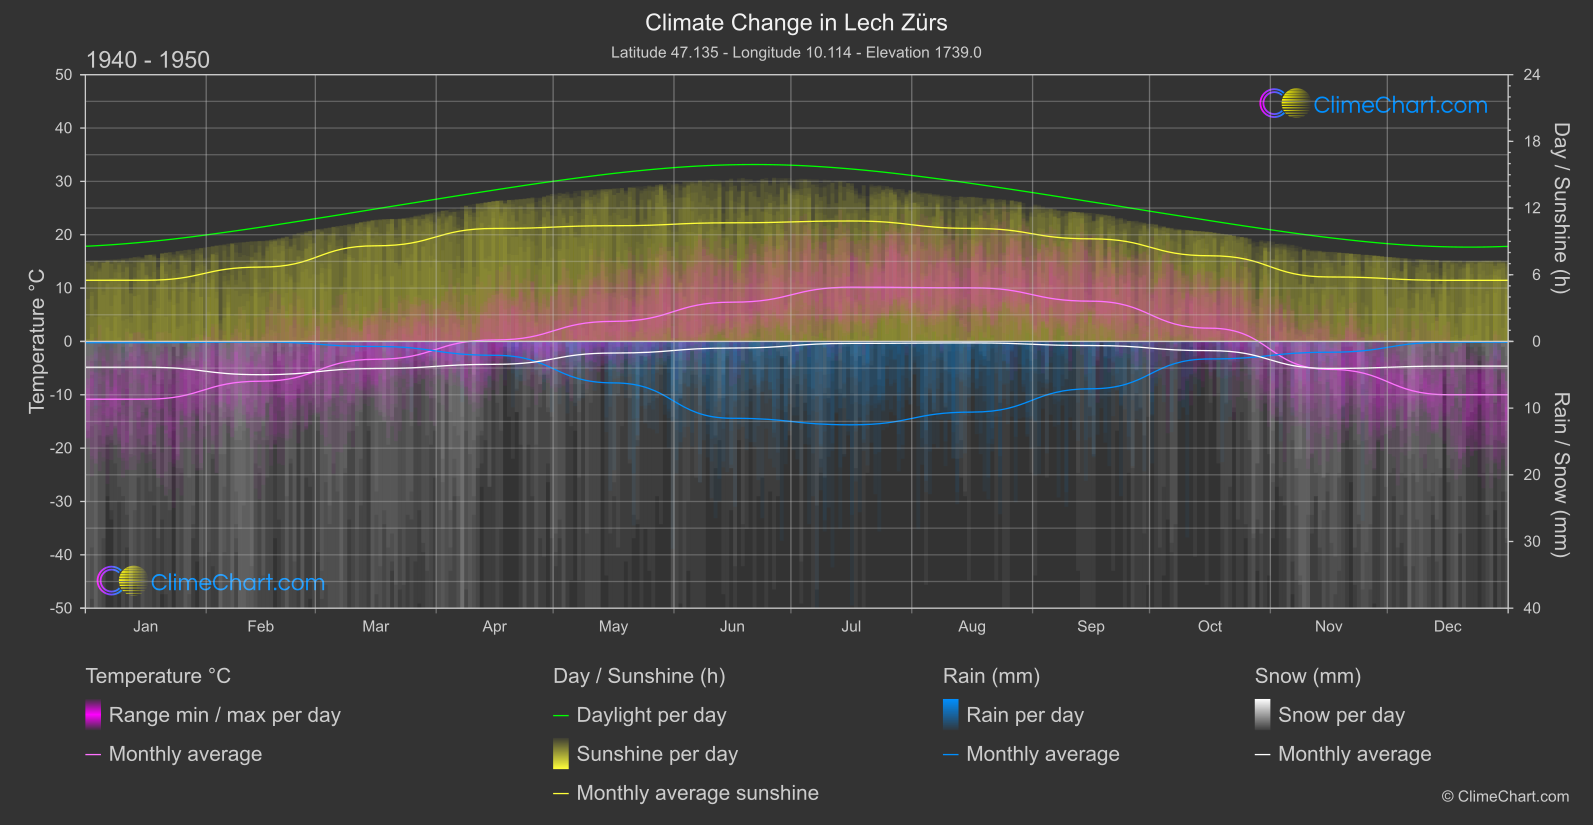
Lech Zürs, Austria, has experienced significant changes in climate over the years. Analyzing the data from 1940 - 1950 compared to 2013 - 2024, we observe interesting patterns. The month with the highest change in temperature is December, with a substantial increase of 5.61°C. On the other hand, October shows the largest change in rainfall, with an increase of 0.99mm. Snowfall has also seen variations, with January experiencing a notable increase of 1.54mm. Furthermore, sunshine duration has fluctuated, with June showing a positive change of 0.41 hours. These insights shed light on the evolving climate in Lech Zürs.
Climate Change Data Overview for Lech Zürs, Austria
Explore the comprehensive climate change data for Lech Zürs, Austria. This detailed table provides valuable insights into temperature variations, precipitation levels, and seasonal changes influenced by climate change, helping you understand the unique weather patterns of this region.
Temperature °C
| Month | ⌀ 1940 - 1950 | ⌀ 2013 - 2023 | +/- |
|---|---|---|---|
| Jan | -10.83 | -6.36 | 4.47 |
| Feb | -7.46 | -4.64 | 2.82 |
| Mar | -3.35 | -2.11 | 1.24 |
| Apr | 0.28 | 1.07 | 0.79 |
| May | 3.76 | 4.80 | 1.04 |
| Jun | 7.36 | 10.50 | 3.14 |
| Jul | 10.17 | 12.37 | 2.20 |
| Aug | 10.05 | 11.86 | 1.82 |
| Sep | 7.55 | 8.21 | 0.66 |
| Oct | 2.48 | 4.72 | 2.24 |
| Nov | -5.23 | -1.23 | 4.01 |
| Dec | -9.99 | -4.38 | 5.61 |
| ⌀ Month | 0.40 | 2.90 | 2.50 |
Sunshine (h)
| Month | ⌀ 1940 - 1950 | ⌀ 2013 - 2023 | +/- |
|---|---|---|---|
| Jan | 5.50 | 5.15 | -0.35 |
| Feb | 6.69 | 6.46 | -0.23 |
| Mar | 8.60 | 8.10 | -0.51 |
| Apr | 10.17 | 9.56 | -0.60 |
| May | 10.41 | 9.44 | -0.97 |
| Jun | 10.67 | 11.08 | 0.41 |
| Jul | 10.84 | 11.20 | 0.37 |
| Aug | 10.17 | 9.97 | -0.20 |
| Sep | 9.23 | 8.82 | -0.41 |
| Oct | 7.71 | 7.23 | -0.48 |
| Nov | 5.80 | 5.60 | -0.20 |
| Dec | 5.50 | 4.80 | -0.69 |
| ⌀ Month | 8.44 | 8.12 | -0.32 |
Rain (mm)
| Month | ⌀ 1940 - 1950 | ⌀ 2013 - 2023 | +/- |
|---|---|---|---|
| Jan | 0.09 | 0.08 | -0.02 |
| Feb | 0.04 | 0.13 | 0.09 |
| Mar | 0.38 | 0.16 | -0.22 |
| Apr | 1.04 | 0.89 | -0.15 |
| May | 3.11 | 3.41 | 0.30 |
| Jun | 5.76 | 5.57 | -0.19 |
| Jul | 6.25 | 5.36 | -0.89 |
| Aug | 5.30 | 5.81 | 0.51 |
| Sep | 3.55 | 3.45 | -0.10 |
| Oct | 1.31 | 2.30 | 0.99 |
| Nov | 0.81 | 0.49 | -0.32 |
| Dec | 0.06 | 0.19 | 0.13 |
| ⌀ Month | 2.31 | 2.32 | 0.01 |
Snow (mm)
| Month | ⌀ 1940 - 1950 | ⌀ 2013 - 2023 | +/- |
|---|---|---|---|
| Jan | 1.93 | 3.47 | 1.54 |
| Feb | 2.49 | 2.88 | 0.38 |
| Mar | 2.03 | 2.59 | 0.56 |
| Apr | 1.72 | 1.96 | 0.25 |
| May | 0.87 | 1.67 | 0.80 |
| Jun | 0.50 | 0.15 | -0.35 |
| Jul | 0.15 | 0.06 | -0.09 |
| Aug | 0.11 | 0.04 | -0.07 |
| Sep | 0.31 | 0.67 | 0.37 |
| Oct | 0.69 | 1.24 | 0.55 |
| Nov | 2.03 | 2.37 | 0.34 |
| Dec | 1.85 | 2.89 | 1.04 |
| ⌀ Month | 1.22 | 1.67 | 0.44 |