Climate Change Chart of Krasnodar, Russian Federation
Comprehensive Climate Change Chart of Krasnodar, Russian Federation: Monthly Averages and Impact Trends
Exploring the climate change in Krasnodar, Russian Federation reveals interesting insights about temperature, rainfall, snowfall, and sunshine duration over the years.
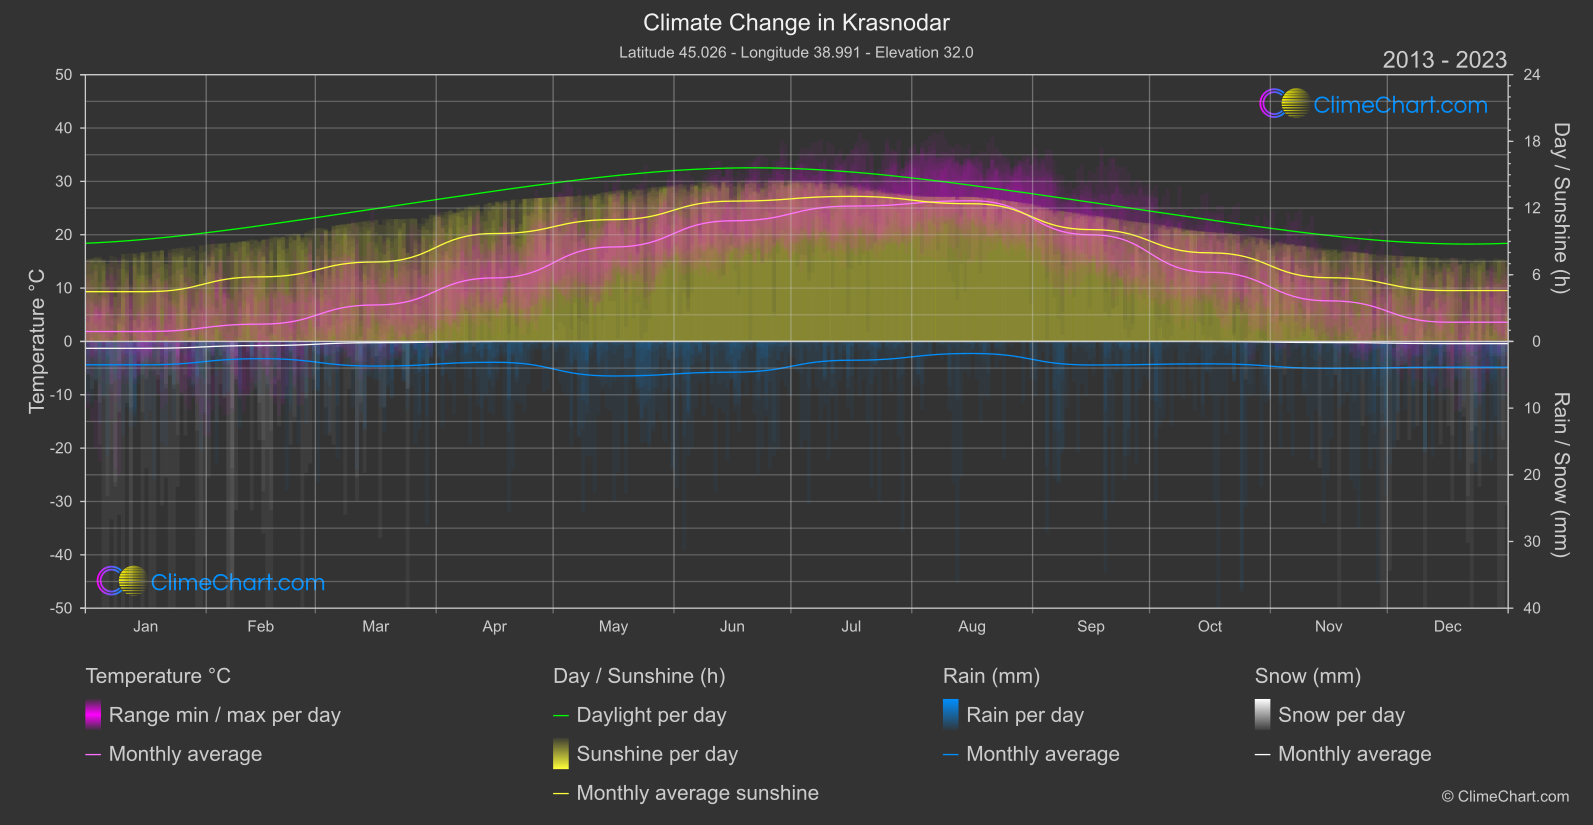
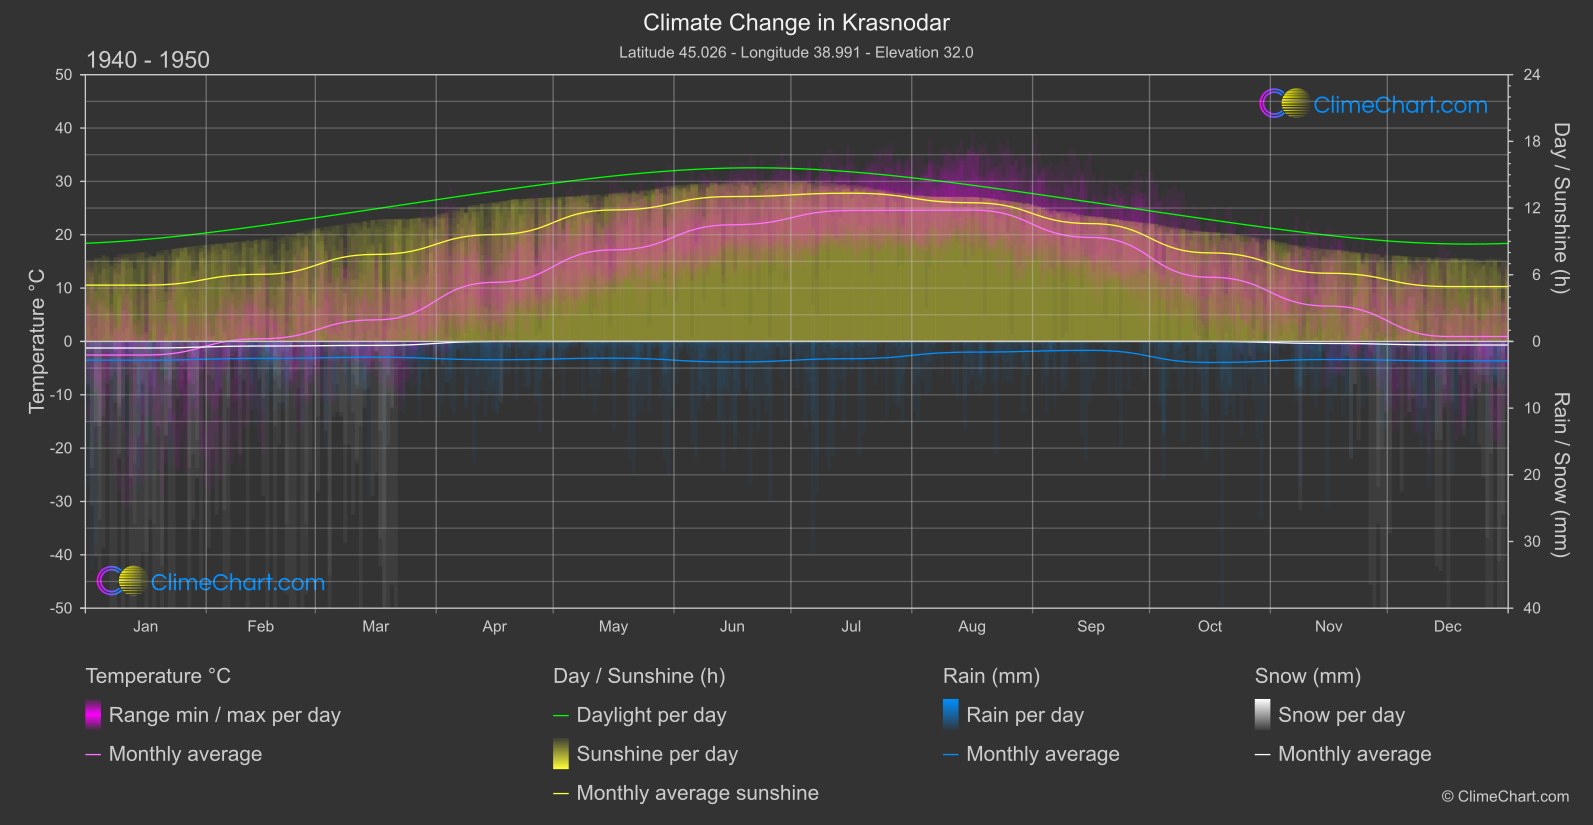
Krasnodar, located in the Russian Federation, has experienced changes in climate patterns over the years. The data shows that the temperature has generally increased, with the month of August showing the highest temperature change. Rainfall has also seen fluctuations, with significant increases in September compared to the past. Snowfall has decreased in many months, especially in March and December. Sunshine duration has shown variations, with a notable decrease in May and June. These trends give valuable insights into the evolving climate of Krasnodar.
Climate Change Data Overview for Krasnodar, Russian Federation
Explore the comprehensive climate change data for Krasnodar, Russian Federation. This detailed table provides valuable insights into temperature variations, precipitation levels, and seasonal changes influenced by climate change, helping you understand the unique weather patterns of this region.
Temperature °C
| Month | ⌀ 1940 - 1950 | ⌀ 2013 - 2023 | +/- |
|---|---|---|---|
| Jan | -2.55 | 1.86 | 4.41 |
| Feb | 0.50 | 3.24 | 2.75 |
| Mar | 4.05 | 6.84 | 2.79 |
| Apr | 11.07 | 11.91 | 0.83 |
| May | 17.16 | 17.71 | 0.55 |
| Jun | 21.87 | 22.61 | 0.74 |
| Jul | 24.55 | 25.37 | 0.82 |
| Aug | 24.61 | 26.37 | 1.75 |
| Sep | 19.49 | 19.99 | 0.49 |
| Oct | 12.03 | 12.96 | 0.93 |
| Nov | 6.63 | 7.61 | 0.99 |
| Dec | 0.92 | 3.60 | 2.68 |
| ⌀ Month | 11.69 | 13.34 | 1.64 |
Sunshine (h)
| Month | ⌀ 1940 - 1950 | ⌀ 2013 - 2023 | +/- |
|---|---|---|---|
| Jan | 5.07 | 4.48 | -0.59 |
| Feb | 6.03 | 5.81 | -0.22 |
| Mar | 7.83 | 7.15 | -0.68 |
| Apr | 9.62 | 9.71 | 0.09 |
| May | 11.83 | 10.96 | -0.87 |
| Jun | 13.04 | 12.62 | -0.41 |
| Jul | 13.34 | 13.05 | -0.29 |
| Aug | 12.48 | 12.39 | -0.09 |
| Sep | 10.60 | 10.06 | -0.54 |
| Oct | 7.97 | 7.97 | 0.01 |
| Nov | 6.13 | 5.73 | -0.40 |
| Dec | 4.94 | 4.58 | -0.36 |
| ⌀ Month | 9.07 | 8.71 | -0.36 |
Rain (mm)
| Month | ⌀ 1940 - 1950 | ⌀ 2013 - 2023 | +/- |
|---|---|---|---|
| Jan | 1.41 | 1.75 | 0.35 |
| Feb | 1.27 | 1.29 | 0.02 |
| Mar | 1.19 | 1.85 | 0.66 |
| Apr | 1.37 | 1.56 | 0.19 |
| May | 1.26 | 2.59 | 1.34 |
| Jun | 1.54 | 2.30 | 0.76 |
| Jul | 1.29 | 1.41 | 0.12 |
| Aug | 0.80 | 0.90 | 0.10 |
| Sep | 0.67 | 1.77 | 1.10 |
| Oct | 1.58 | 1.68 | 0.10 |
| Nov | 1.36 | 2.02 | 0.66 |
| Dec | 1.46 | 1.93 | 0.47 |
| ⌀ Month | 1.27 | 1.75 | 0.49 |
Snow (mm)
| Month | ⌀ 1940 - 1950 | ⌀ 2013 - 2023 | +/- |
|---|---|---|---|
| Jan | 0.49 | 0.51 | 0.02 |
| Feb | 0.34 | 0.31 | -0.04 |
| Mar | 0.30 | 0.09 | -0.20 |
| Apr | 0.00 | 0.00 | -0.00 |
| May | 0.00 | 0.00 | 0.00 |
| Jun | 0.00 | 0.00 | 0.00 |
| Jul | 0.00 | 0.00 | 0.00 |
| Aug | 0.00 | 0.00 | 0.00 |
| Sep | 0.00 | 0.00 | 0.00 |
| Oct | 0.00 | 0.00 | 0.00 |
| Nov | 0.15 | 0.08 | -0.07 |
| Dec | 0.27 | 0.16 | -0.11 |
| ⌀ Month | 0.13 | 0.10 | -0.03 |