Climate Change Chart of Carson City, USA
Comprehensive Climate Change Chart of Carson City, USA: Monthly Averages and Impact Trends
Explore the changing climate in Carson City, USA with insights from temperature, rainfall, snowfall, and sunshine duration data. Discover how the climate has evolved over the years.
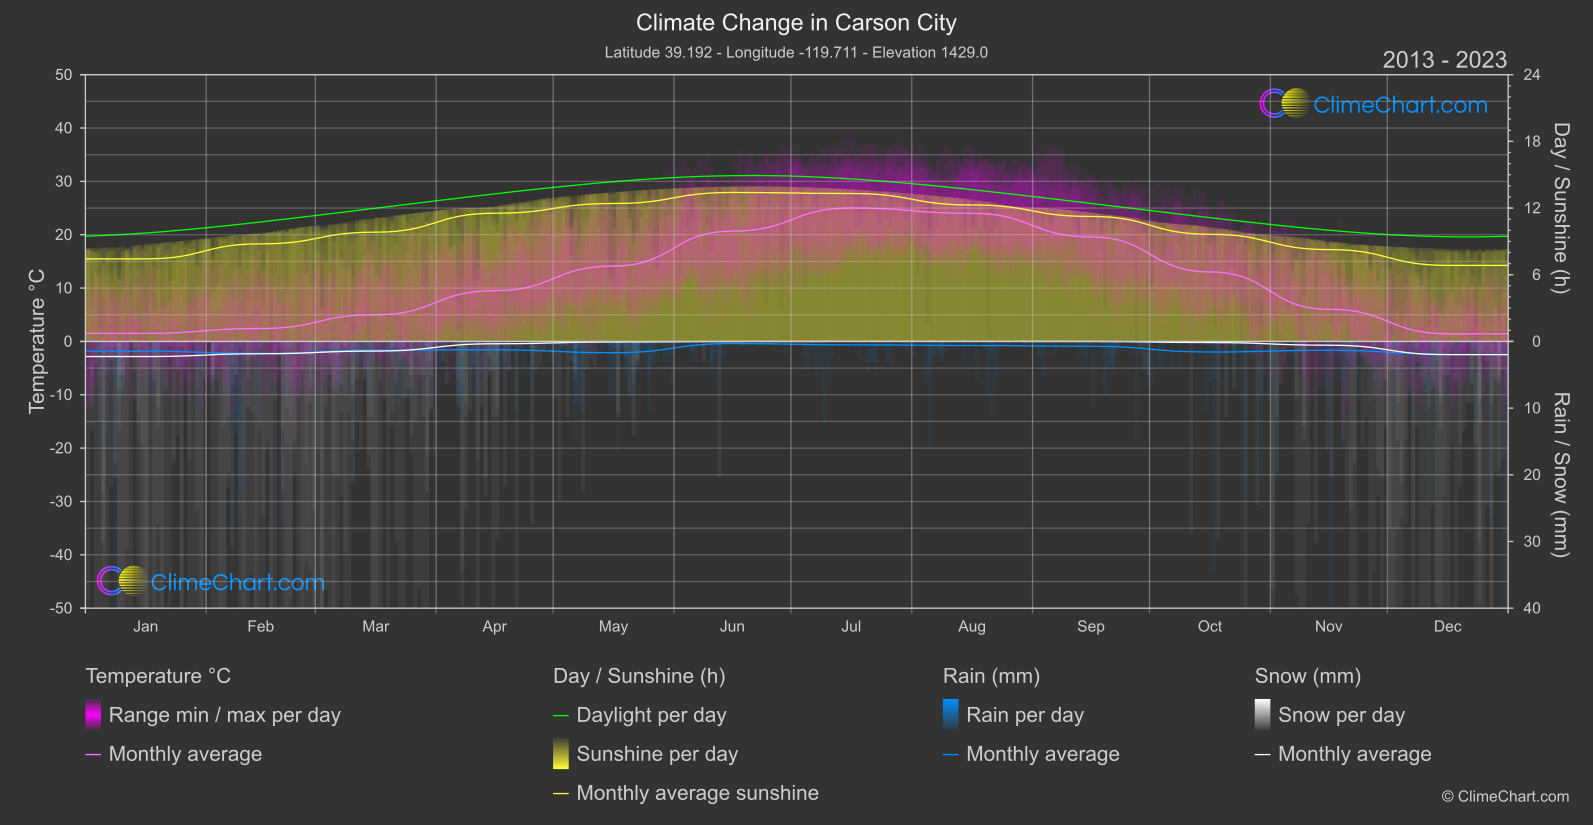
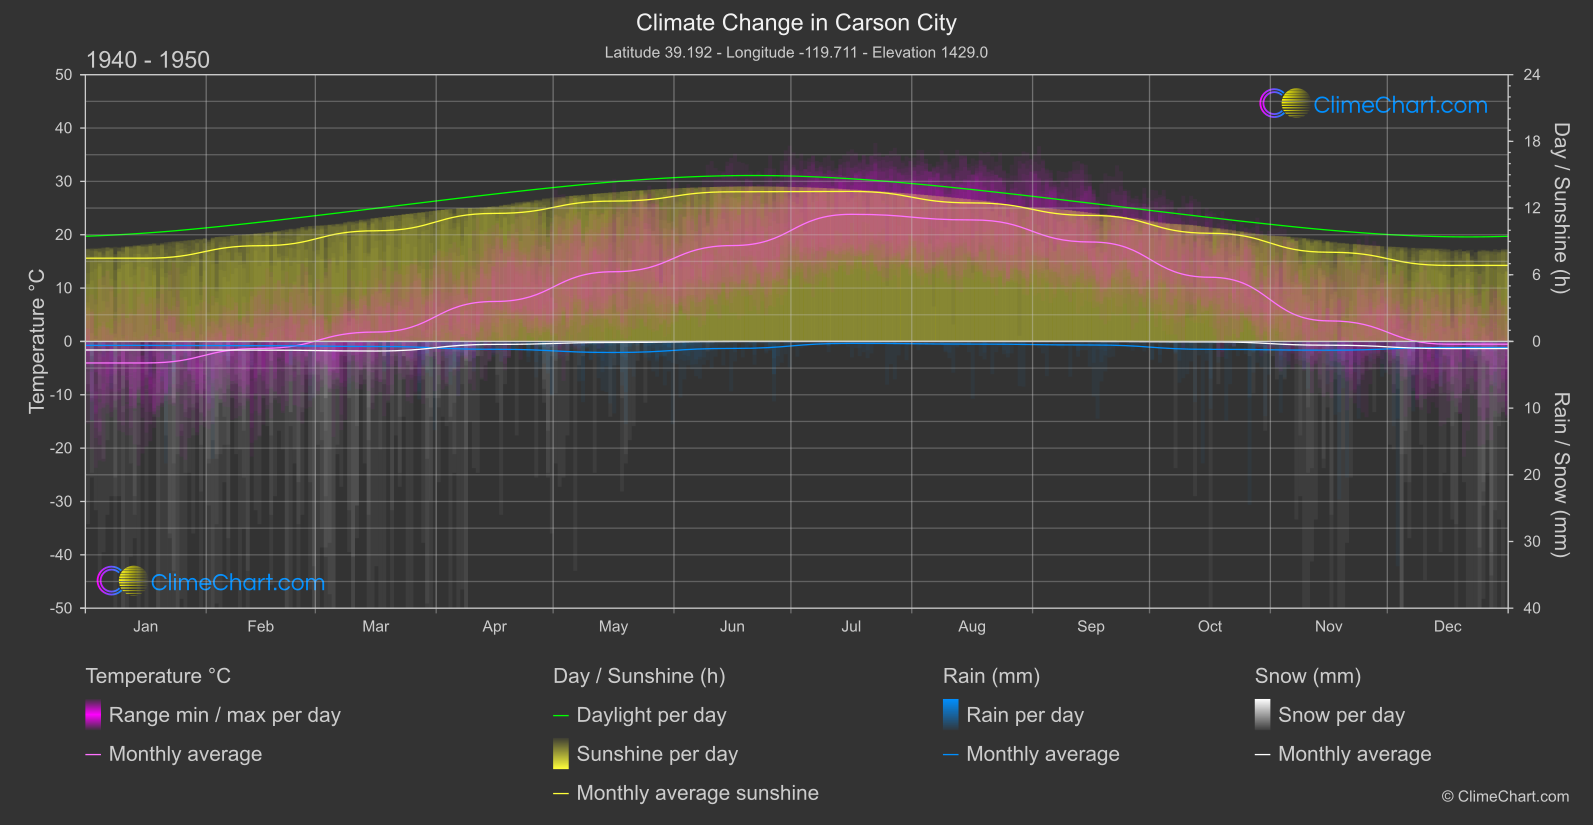
Carson City, USA, has experienced significant changes in climate over the years. Analyzing the temperature data reveals that June has seen the highest increase in temperature, with a change of 2.70°C from 1940-1950 to 2013-2024. In terms of rainfall, December has experienced the most notable change, with a 0.51mm increase in precipitation. Snowfall in January has seen a significant rise, with a 0.49mm increase from the two time periods. Additionally, the sunshine duration in November has notably increased by 0.24 hours.
Climate Change Data Overview for Carson City, USA
Explore the comprehensive climate change data for Carson City, USA. This detailed table provides valuable insights into temperature variations, precipitation levels, and seasonal changes influenced by climate change, helping you understand the unique weather patterns of this region.
Temperature °C
| Month | ⌀ 1940 - 1950 | ⌀ 2013 - 2023 | +/- |
|---|---|---|---|
| Jan | -4.04 | 1.51 | 5.55 |
| Feb | -1.31 | 2.43 | 3.74 |
| Mar | 1.76 | 5.01 | 3.25 |
| Apr | 7.49 | 9.52 | 2.03 |
| May | 13.06 | 14.14 | 1.07 |
| Jun | 17.97 | 20.67 | 2.70 |
| Jul | 23.83 | 25.02 | 1.19 |
| Aug | 22.78 | 24.01 | 1.24 |
| Sep | 18.64 | 19.59 | 0.95 |
| Oct | 12.03 | 13.03 | 1.00 |
| Nov | 3.85 | 6.03 | 2.17 |
| Dec | -0.52 | 1.43 | 1.95 |
| ⌀ Month | 9.63 | 11.87 | 2.24 |
Sunshine (h)
| Month | ⌀ 1940 - 1950 | ⌀ 2013 - 2023 | +/- |
|---|---|---|---|
| Jan | 7.49 | 7.43 | -0.06 |
| Feb | 8.61 | 8.78 | 0.16 |
| Mar | 9.96 | 9.83 | -0.12 |
| Apr | 11.52 | 11.53 | 0.01 |
| May | 12.63 | 12.41 | -0.22 |
| Jun | 13.46 | 13.40 | -0.06 |
| Jul | 13.50 | 13.31 | -0.19 |
| Aug | 12.46 | 12.28 | -0.19 |
| Sep | 11.34 | 11.24 | -0.09 |
| Oct | 9.73 | 9.64 | -0.09 |
| Nov | 8.02 | 8.27 | 0.24 |
| Dec | 6.84 | 6.84 | -0.00 |
| ⌀ Month | 10.46 | 10.41 | -0.05 |
Rain (mm)
| Month | ⌀ 1940 - 1950 | ⌀ 2013 - 2023 | +/- |
|---|---|---|---|
| Jan | 0.30 | 0.73 | 0.44 |
| Feb | 0.32 | 0.90 | 0.58 |
| Mar | 0.38 | 0.66 | 0.28 |
| Apr | 0.59 | 0.62 | 0.03 |
| May | 0.83 | 0.84 | 0.02 |
| Jun | 0.52 | 0.16 | -0.37 |
| Jul | 0.14 | 0.26 | 0.12 |
| Aug | 0.20 | 0.30 | 0.11 |
| Sep | 0.27 | 0.36 | 0.10 |
| Oct | 0.59 | 0.79 | 0.20 |
| Nov | 0.66 | 0.66 | 0.01 |
| Dec | 0.46 | 0.97 | 0.51 |
| ⌀ Month | 0.44 | 0.61 | 0.17 |
Snow (mm)
| Month | ⌀ 1940 - 1950 | ⌀ 2013 - 2023 | +/- |
|---|---|---|---|
| Jan | 0.64 | 1.13 | 0.49 |
| Feb | 0.65 | 0.92 | 0.27 |
| Mar | 0.72 | 0.72 | 0.00 |
| Apr | 0.22 | 0.17 | -0.05 |
| May | 0.08 | 0.04 | -0.04 |
| Jun | 0.00 | 0.01 | 0.01 |
| Jul | 0.00 | 0.00 | 0.00 |
| Aug | 0.00 | 0.00 | 0.00 |
| Sep | 0.00 | 0.00 | 0.00 |
| Oct | 0.03 | 0.08 | 0.05 |
| Nov | 0.28 | 0.28 | -0.00 |
| Dec | 0.53 | 0.99 | 0.46 |
| ⌀ Month | 0.26 | 0.36 | 0.10 |