Climate Chart of Carson City, USA
Comprehensive Climate Chart of Carson City, USA: Monthly Averages and Weather Trends
Welcome to Carson City, USA! Learn about the climate and weather in this beautiful city.
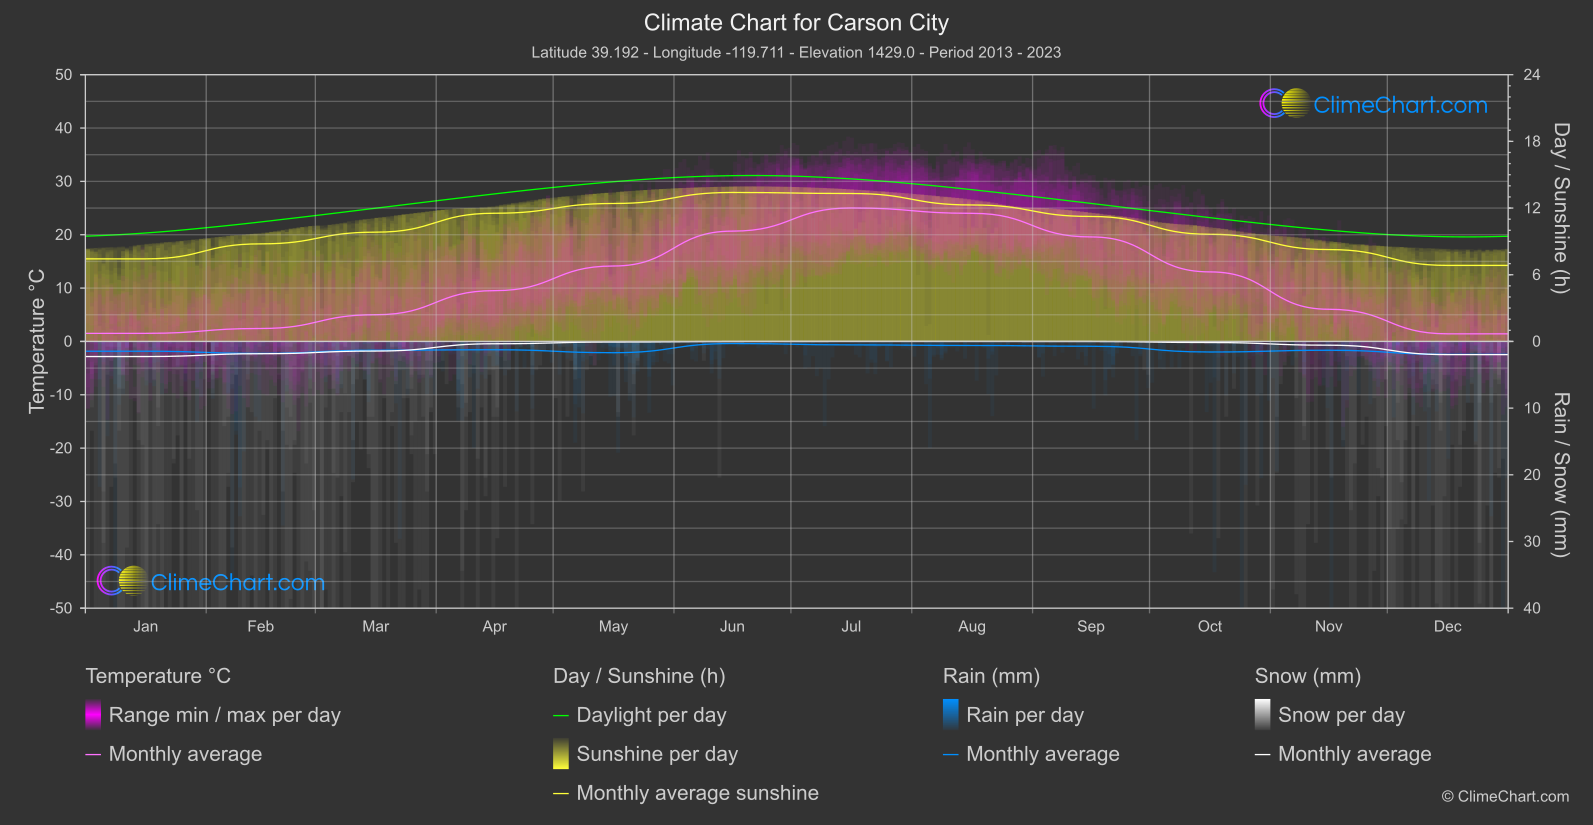
Carson City, located in Nevada, has a semi-arid climate with hot summers and cold winters. The city experiences low humidity and receives around 10 inches of rainfall annually. Snowfall is common in winter, making it a picturesque sight. The average temperature ranges from 20°F in winter to 90°F in summer.
Best Travel Time Guide for Carson City, USA: Ideal Seasons and Weather Insights
The best time to travel to Carson City is during the spring and fall when the weather is mild and pleasant. Summer offers warm temperatures but can be hot, while winter can be cold with snowfall. Consider visiting in April-May or September-October for ideal weather conditions.
Climate Data Overview for Carson City, USA
Explore the comprehensive climate data for Carson City, USA. This detailed table provides valuable insights into temperature variations, precipitation levels, and seasonal changes, helping you understand the unique weather patterns of this region.
| Month | ⌀ Temperature °C | ⌀ Rain (mm) | ⌀ Snow (mm) | ⌀ Sunshine (h) |
|---|---|---|---|---|
| Jan | 1.5 | 0.73 | 1.13 | 7.43 |
| Feb | 2.4 | 0.90 | 0.92 | 8.78 |
| Mar | 5.0 | 0.66 | 0.72 | 9.83 |
| Apr | 9.5 | 0.62 | 0.17 | 11.53 |
| May | 14.1 | 0.84 | 0.04 | 12.41 |
| Jun | 20.7 | 0.16 | 0.01 | 13.40 |
| Jul | 25.0 | 0.26 | 0.00 | 13.31 |
| Aug | 24.0 | 0.30 | 0.00 | 12.28 |
| Sep | 19.6 | 0.36 | 0.00 | 11.24 |
| Oct | 13.0 | 0.79 | 0.08 | 9.64 |
| Nov | 6.0 | 0.66 | 0.28 | 8.27 |
| Dec | 1.4 | 0.97 | 0.99 | 6.84 |
| ⌀ Month | 11.8 | 0.60 | 0.36 | 10.41 |