Climate Change Chart of Breckenridge, USA
Comprehensive Climate Change Chart of Breckenridge, USA: Monthly Averages and Impact Trends
Explore the changing climate data of Breckenridge, United States of America with insights on temperature, rainfall, snowfall, and sunshine duration.
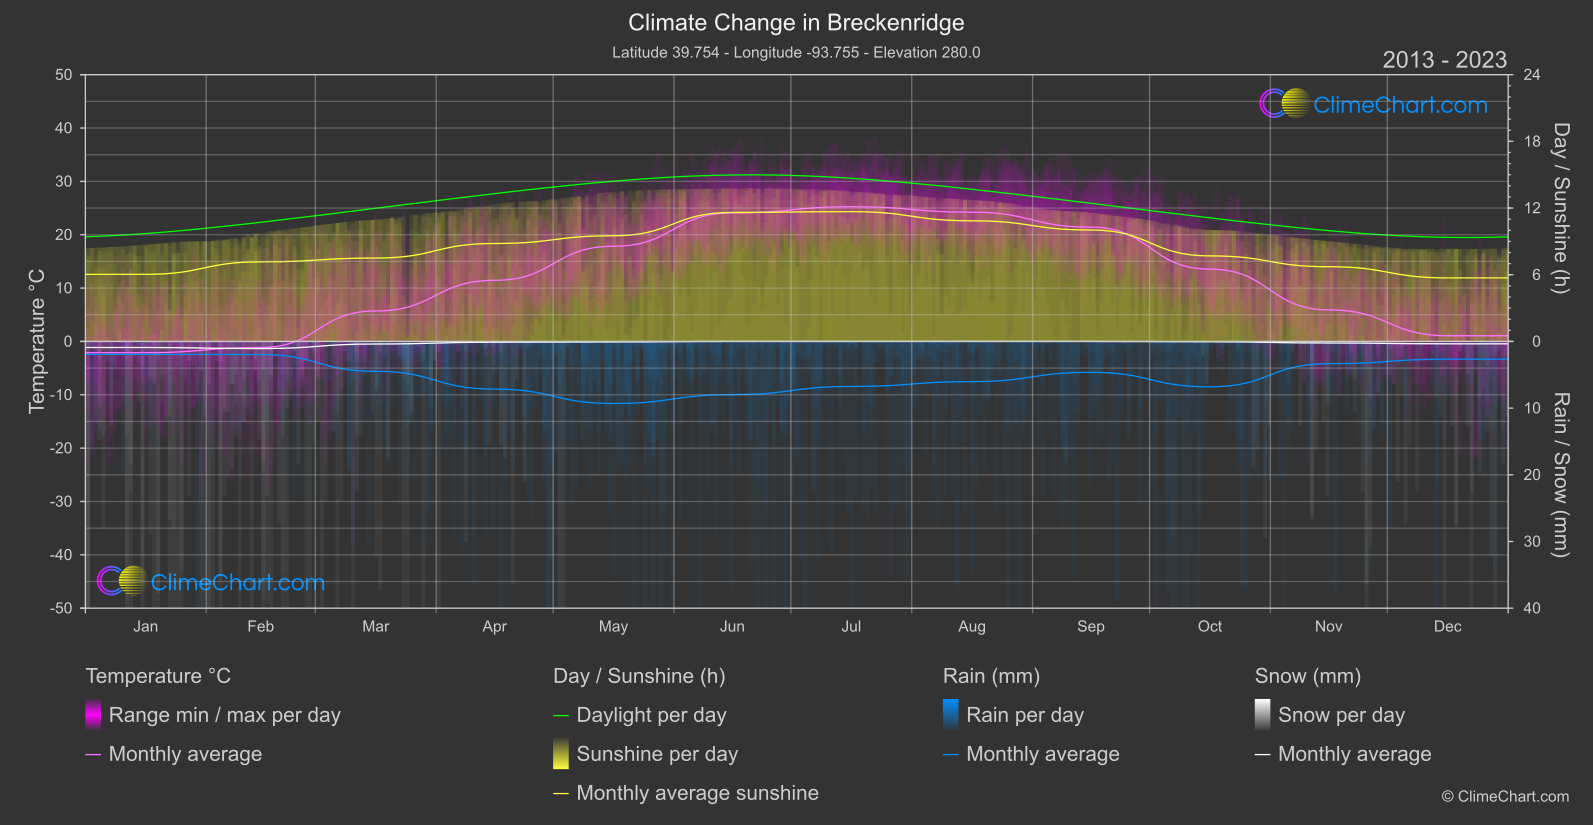
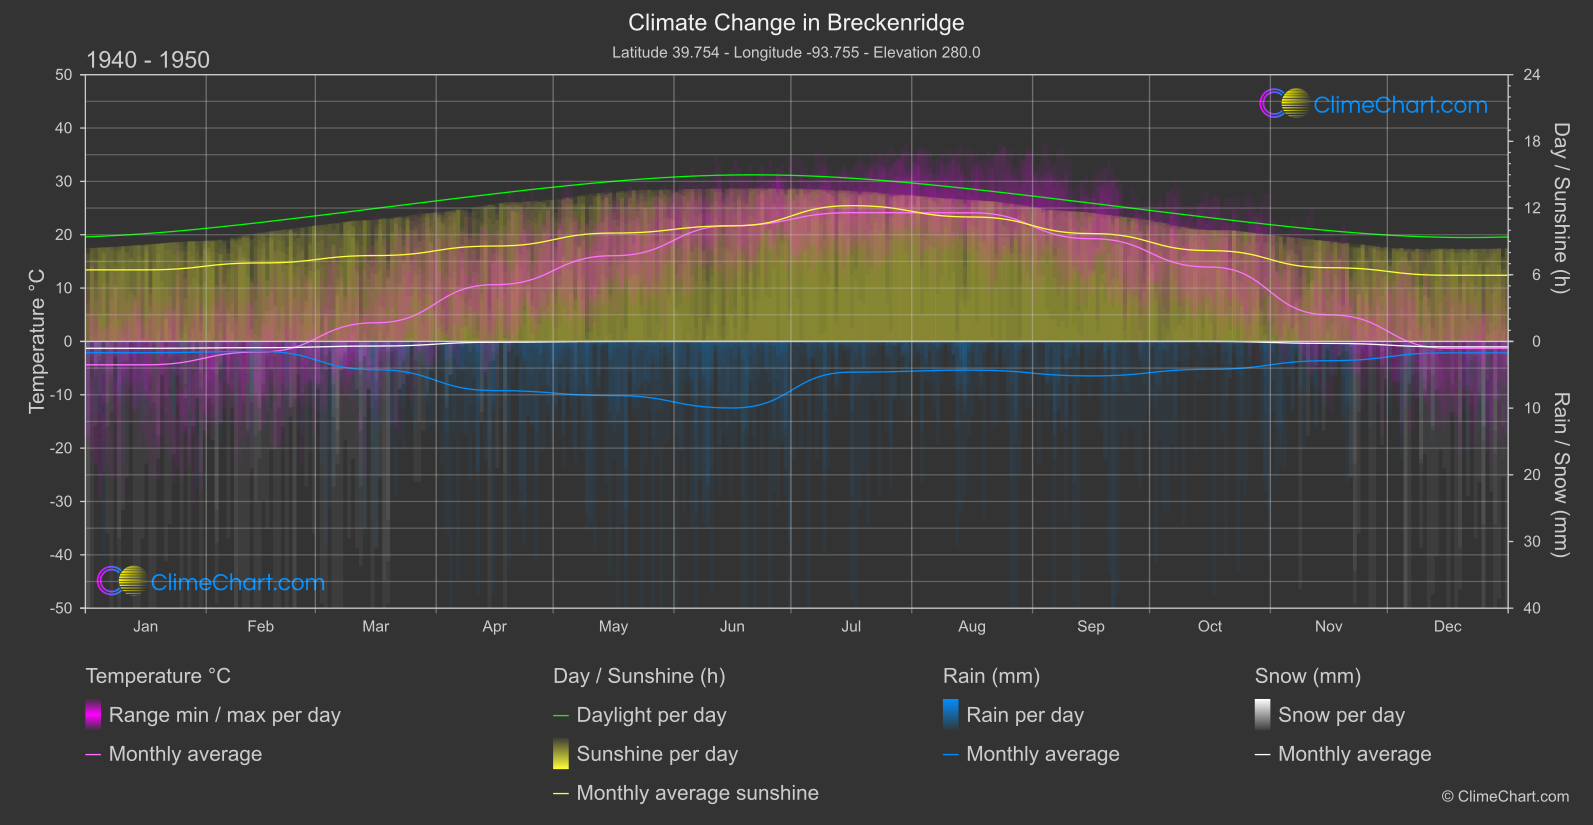
Breckenridge, located in the United States, has experienced noticeable shifts in climate over the years. From temperature changes to variations in rainfall, snowfall, and sunshine duration, the data provides valuable insights into the evolving weather patterns of this region. The analysis showcases how certain months exhibit significant fluctuations, highlighting the impact of climate change on Breckenridge's environment.
Climate Change Data Overview for Breckenridge, USA
Explore the comprehensive climate change data for Breckenridge, USA. This detailed table provides valuable insights into temperature variations, precipitation levels, and seasonal changes influenced by climate change, helping you understand the unique weather patterns of this region.
Temperature °C
| Month | ⌀ 1940 - 1950 | ⌀ 2013 - 2023 | +/- |
|---|---|---|---|
| Jan | -4.38 | -2.11 | 2.27 |
| Feb | -1.96 | -1.13 | 0.82 |
| Mar | 3.50 | 5.71 | 2.21 |
| Apr | 10.64 | 11.45 | 0.81 |
| May | 16.07 | 17.84 | 1.77 |
| Jun | 21.71 | 24.08 | 2.37 |
| Jul | 24.14 | 25.25 | 1.12 |
| Aug | 24.11 | 24.22 | 0.11 |
| Sep | 19.26 | 21.43 | 2.17 |
| Oct | 13.94 | 13.55 | -0.39 |
| Nov | 4.98 | 5.92 | 0.93 |
| Dec | -1.29 | 1.07 | 2.36 |
| ⌀ Month | 10.89 | 12.27 | 1.38 |
Sunshine (h)
| Month | ⌀ 1940 - 1950 | ⌀ 2013 - 2023 | +/- |
|---|---|---|---|
| Jan | 6.44 | 6.04 | -0.40 |
| Feb | 7.06 | 7.16 | 0.10 |
| Mar | 7.73 | 7.50 | -0.22 |
| Apr | 8.58 | 8.81 | 0.23 |
| May | 9.75 | 9.51 | -0.24 |
| Jun | 10.40 | 11.61 | 1.21 |
| Jul | 12.21 | 11.68 | -0.54 |
| Aug | 11.20 | 10.85 | -0.35 |
| Sep | 9.71 | 10.02 | 0.32 |
| Oct | 8.17 | 7.70 | -0.48 |
| Nov | 6.63 | 6.72 | 0.09 |
| Dec | 5.95 | 5.72 | -0.24 |
| ⌀ Month | 8.65 | 8.61 | -0.04 |
Rain (mm)
| Month | ⌀ 1940 - 1950 | ⌀ 2013 - 2023 | +/- |
|---|---|---|---|
| Jan | 0.85 | 0.97 | 0.12 |
| Feb | 0.75 | 0.98 | 0.24 |
| Mar | 2.12 | 2.24 | 0.12 |
| Apr | 3.69 | 3.57 | -0.11 |
| May | 4.06 | 4.65 | 0.59 |
| Jun | 4.99 | 3.99 | -1.00 |
| Jul | 2.30 | 3.38 | 1.08 |
| Aug | 2.15 | 3.01 | 0.86 |
| Sep | 2.59 | 2.32 | -0.27 |
| Oct | 2.09 | 3.40 | 1.31 |
| Nov | 1.45 | 1.67 | 0.22 |
| Dec | 0.86 | 1.33 | 0.47 |
| ⌀ Month | 2.32 | 2.63 | 0.30 |
Snow (mm)
| Month | ⌀ 1940 - 1950 | ⌀ 2013 - 2023 | +/- |
|---|---|---|---|
| Jan | 0.51 | 0.46 | -0.06 |
| Feb | 0.47 | 0.53 | 0.06 |
| Mar | 0.35 | 0.19 | -0.15 |
| Apr | 0.06 | 0.06 | -0.00 |
| May | 0.00 | 0.04 | 0.04 |
| Jun | 0.00 | 0.00 | 0.00 |
| Jul | 0.00 | 0.00 | 0.00 |
| Aug | 0.00 | 0.00 | 0.00 |
| Sep | 0.00 | 0.00 | 0.00 |
| Oct | 0.00 | 0.03 | 0.03 |
| Nov | 0.15 | 0.12 | -0.03 |
| Dec | 0.40 | 0.18 | -0.23 |
| ⌀ Month | 0.16 | 0.13 | -0.03 |