Climate Chart of York, Great Britain
Comprehensive Climate Chart of York, Great Britain: Monthly Averages and Weather Trends
Discover the climate of York, United Kingdom
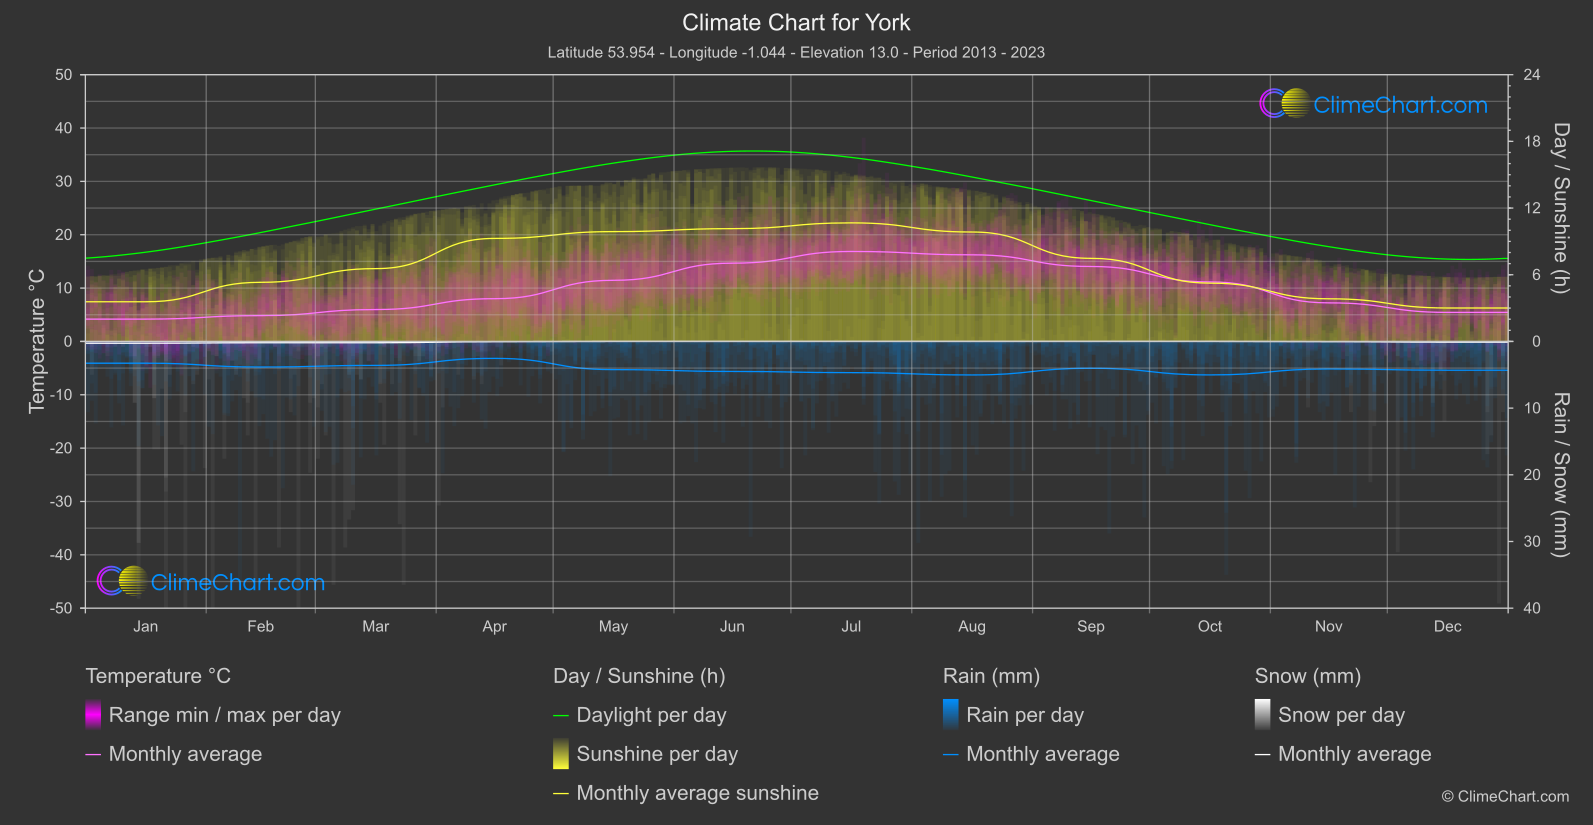
York, United Kingdom experiences a temperate maritime climate with cool summers and mild winters. Rainfall is evenly distributed throughout the year, with the wettest months being from October to January. The average temperature ranges from 1°C (34°F) in winter to 20°C (68°F) in summer. Visitors to York can expect some rainfall and cool temperatures, so it's advisable to pack layers and waterproof clothing.
Best Travel Time Guide for York, Great Britain: Ideal Seasons and Weather Insights
The best time to travel to York is during the summer months of June to August when the weather is mild and the city is bustling with activities. However, if you prefer fewer crowds, consider visiting during the shoulder seasons of spring (March to May) and autumn (September to November). Winter (December to February) can be cold and rainy, but the city is less crowded, offering a more peaceful experience.
Climate Data Overview for York, Great Britain
Explore the comprehensive climate data for York, Great Britain. This detailed table provides valuable insights into temperature variations, precipitation levels, and seasonal changes, helping you understand the unique weather patterns of this region.
| Month | ⌀ Temperature °C | ⌀ Rain (mm) | ⌀ Snow (mm) | ⌀ Sunshine (h) |
|---|---|---|---|---|
| Jan | 4.2 | 1.63 | 0.13 | 3.57 |
| Feb | 4.8 | 1.92 | 0.10 | 5.32 |
| Mar | 6.0 | 1.80 | 0.10 | 6.55 |
| Apr | 8.0 | 1.27 | 0.02 | 9.27 |
| May | 11.5 | 2.11 | 0.00 | 9.88 |
| Jun | 14.7 | 2.25 | 0.00 | 10.15 |
| Jul | 16.9 | 2.34 | 0.00 | 10.67 |
| Aug | 16.2 | 2.51 | 0.00 | 9.84 |
| Sep | 14.0 | 2.01 | 0.00 | 7.48 |
| Oct | 11.2 | 2.51 | 0.00 | 5.25 |
| Nov | 7.2 | 2.06 | 0.02 | 3.84 |
| Dec | 5.4 | 2.16 | 0.05 | 3.01 |
| ⌀ Month | 10.0 | 2.05 | 0.04 | 7.07 |