Climate Change Chart of York, Great Britain
Comprehensive Climate Change Chart of York, Great Britain: Monthly Averages and Impact Trends
Explore the changing climate in York, United Kingdom of Great Britain and Northern Ireland through insightful data analysis.
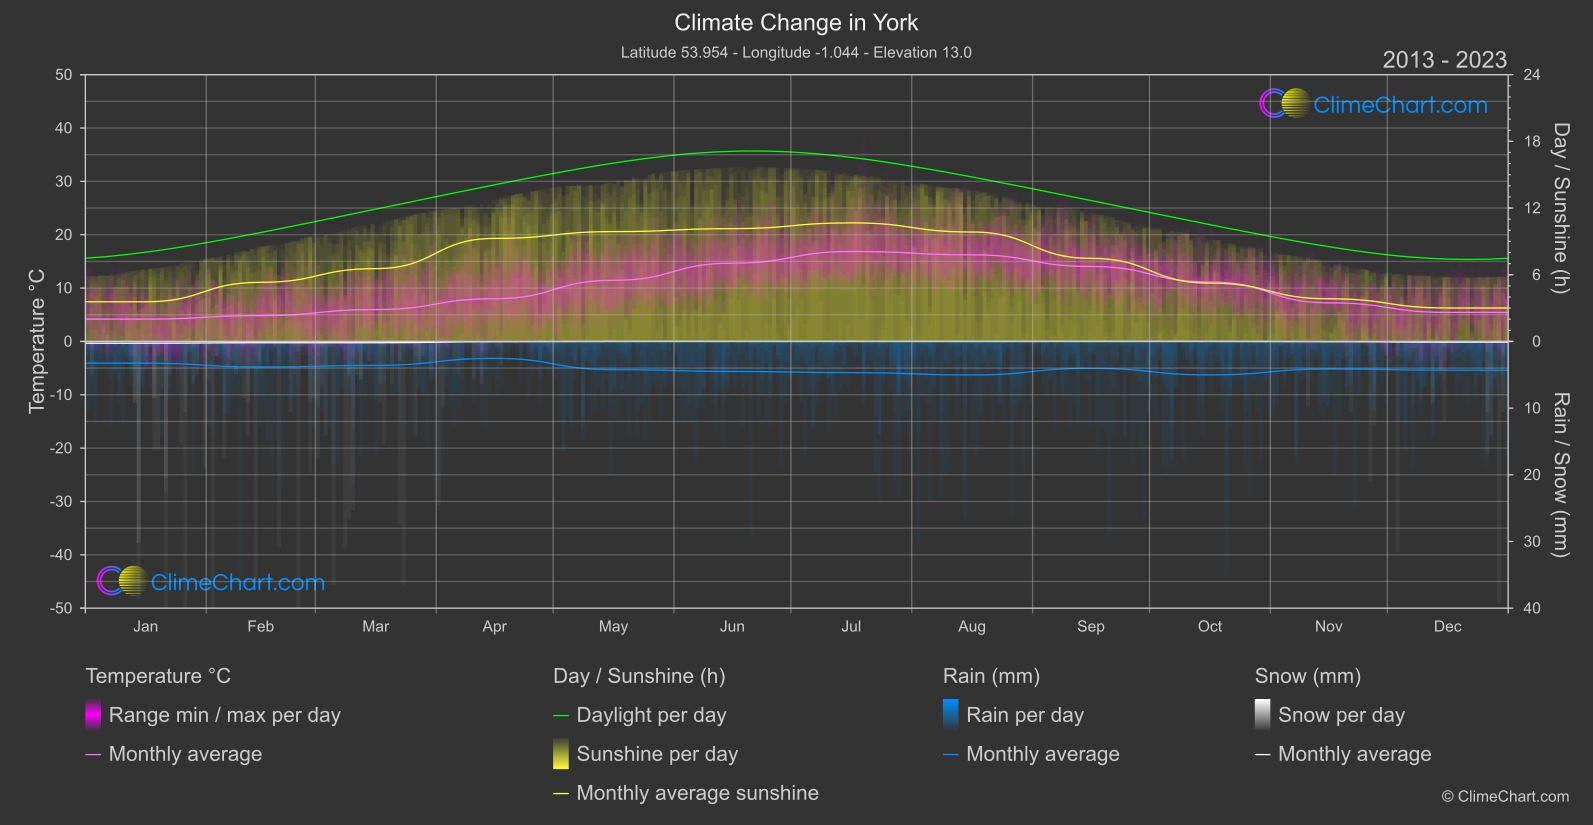
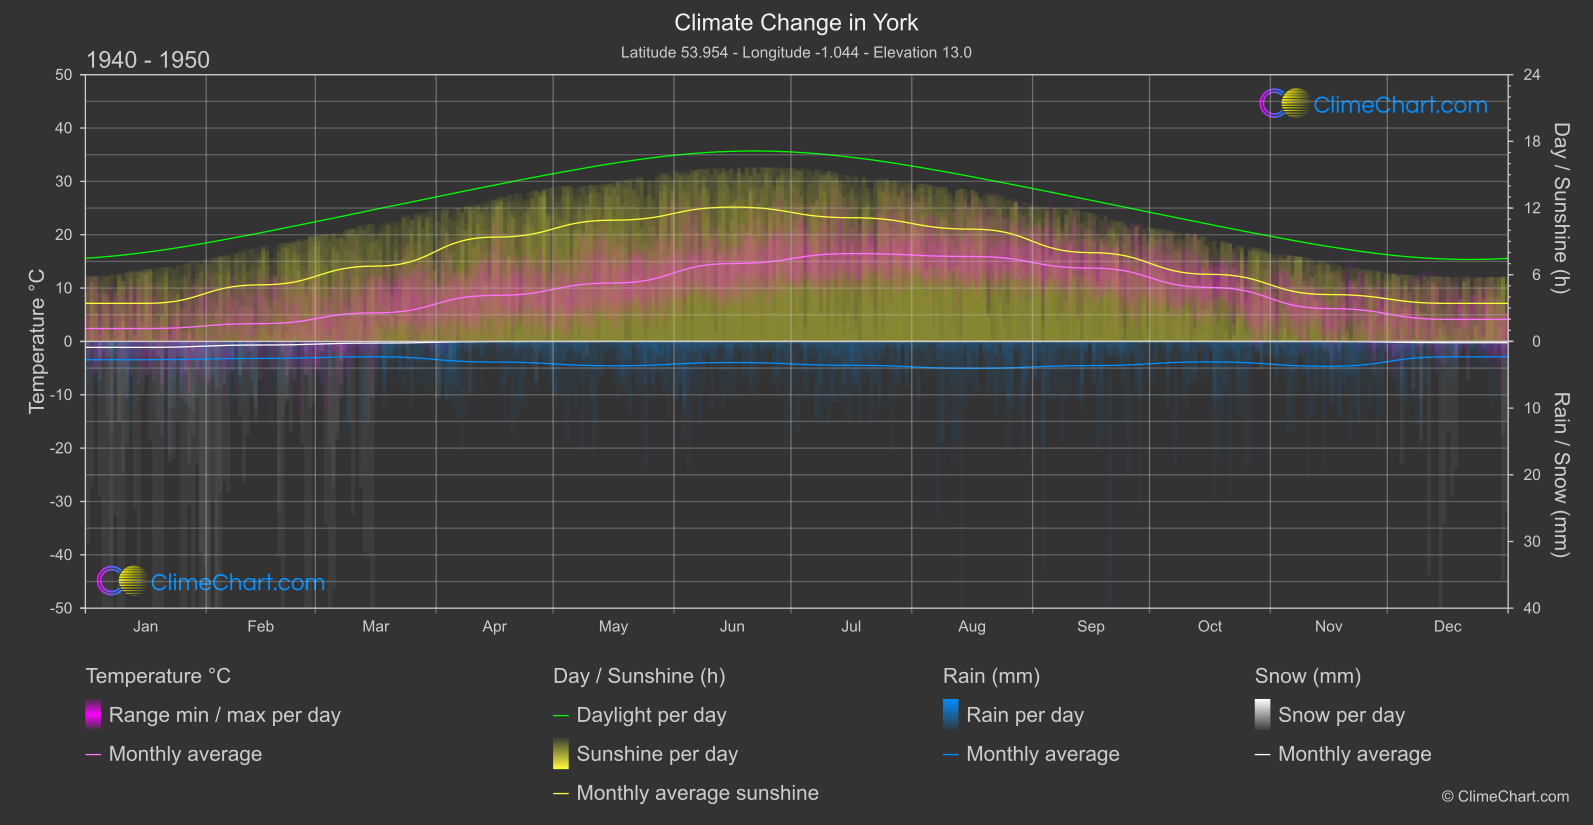
York, United Kingdom of Great Britain and Northern Ireland, experiences varying climate patterns with notable changes in temperature, rainfall, snowfall, and sunshine duration. Analyzing the data from 1940-1950 and comparing it to 2013-2024 reveals interesting insights. For instance, the month with the highest temperature change is November, with a significant increase of 1.07°C. On the other hand, the month with the highest rainfall change is October, showing an increase of 0.98mm. Snowfall has generally decreased over the years, with significant changes in January and March. Sunshine duration has also shown fluctuations, with May experiencing a notable decrease in hours of sunshine.
Climate Change Data Overview for York, Great Britain
Explore the comprehensive climate change data for York, Great Britain. This detailed table provides valuable insights into temperature variations, precipitation levels, and seasonal changes influenced by climate change, helping you understand the unique weather patterns of this region.
Temperature °C
| Month | ⌀ 1940 - 1950 | ⌀ 2013 - 2023 | +/- |
|---|---|---|---|
| Jan | 2.42 | 4.18 | 1.76 |
| Feb | 3.34 | 4.84 | 1.50 |
| Mar | 5.35 | 5.98 | 0.62 |
| Apr | 8.63 | 8.01 | -0.62 |
| May | 10.95 | 11.46 | 0.51 |
| Jun | 14.60 | 14.67 | 0.06 |
| Jul | 16.46 | 16.86 | 0.40 |
| Aug | 15.92 | 16.23 | 0.32 |
| Sep | 13.75 | 14.05 | 0.30 |
| Oct | 10.12 | 11.15 | 1.03 |
| Nov | 6.16 | 7.23 | 1.07 |
| Dec | 4.13 | 5.44 | 1.31 |
| ⌀ Month | 9.32 | 10.01 | 0.69 |
Sunshine (h)
| Month | ⌀ 1940 - 1950 | ⌀ 2013 - 2023 | +/- |
|---|---|---|---|
| Jan | 3.42 | 3.57 | 0.15 |
| Feb | 5.09 | 5.32 | 0.23 |
| Mar | 6.78 | 6.55 | -0.23 |
| Apr | 9.39 | 9.27 | -0.12 |
| May | 10.91 | 9.88 | -1.03 |
| Jun | 12.08 | 10.15 | -1.94 |
| Jul | 11.13 | 10.67 | -0.46 |
| Aug | 10.10 | 9.84 | -0.26 |
| Sep | 7.99 | 7.48 | -0.51 |
| Oct | 6.04 | 5.25 | -0.79 |
| Nov | 4.22 | 3.84 | -0.38 |
| Dec | 3.42 | 3.01 | -0.42 |
| ⌀ Month | 7.55 | 7.07 | -0.48 |
Rain (mm)
| Month | ⌀ 1940 - 1950 | ⌀ 2013 - 2023 | +/- |
|---|---|---|---|
| Jan | 1.37 | 1.63 | 0.26 |
| Feb | 1.27 | 1.92 | 0.65 |
| Mar | 1.15 | 1.80 | 0.65 |
| Apr | 1.55 | 1.27 | -0.28 |
| May | 1.82 | 2.11 | 0.29 |
| Jun | 1.58 | 2.25 | 0.67 |
| Jul | 1.79 | 2.34 | 0.55 |
| Aug | 2.02 | 2.51 | 0.50 |
| Sep | 1.81 | 2.01 | 0.20 |
| Oct | 1.53 | 2.51 | 0.98 |
| Nov | 1.86 | 2.06 | 0.20 |
| Dec | 1.16 | 2.16 | 1.00 |
| ⌀ Month | 1.58 | 2.05 | 0.47 |
Snow (mm)
| Month | ⌀ 1940 - 1950 | ⌀ 2013 - 2023 | +/- |
|---|---|---|---|
| Jan | 0.45 | 0.13 | -0.31 |
| Feb | 0.27 | 0.10 | -0.17 |
| Mar | 0.12 | 0.10 | -0.02 |
| Apr | 0.01 | 0.02 | 0.01 |
| May | 0.00 | 0.00 | -0.00 |
| Jun | 0.00 | 0.00 | 0.00 |
| Jul | 0.00 | 0.00 | 0.00 |
| Aug | 0.00 | 0.00 | 0.00 |
| Sep | 0.00 | 0.00 | 0.00 |
| Oct | 0.00 | 0.00 | -0.00 |
| Nov | 0.00 | 0.02 | 0.01 |
| Dec | 0.09 | 0.05 | -0.04 |
| ⌀ Month | 0.08 | 0.04 | -0.04 |