Climate Chart of Windhoek, Namibia
Comprehensive Climate Chart of Windhoek, Namibia: Monthly Averages and Weather Trends
Welcome to Windhoek, Namibia!
Windhoek, the capital city of Namibia, is known for its pleasant weather and diverse climate. The city experiences a semi-arid climate with hot summers and mild winters. The average annual temperature is around 20°C (68°F), with temperatures often reaching highs of 30°C (86°F) in the summer months. The rainy season typically occurs from November to March, bringing occasional thunderstorms and refreshing showers.
Best Travel Time Guide for Windhoek, Namibia: Ideal Seasons and Weather Insights
The best time to visit Windhoek is during the dry season from May to September when the weather is cooler and perfect for outdoor activities. This period offers clear skies, sunny days, and comfortable temperatures for exploring the city and its surroundings. If you prefer to avoid the heat, plan your trip during these months for an enjoyable experience.
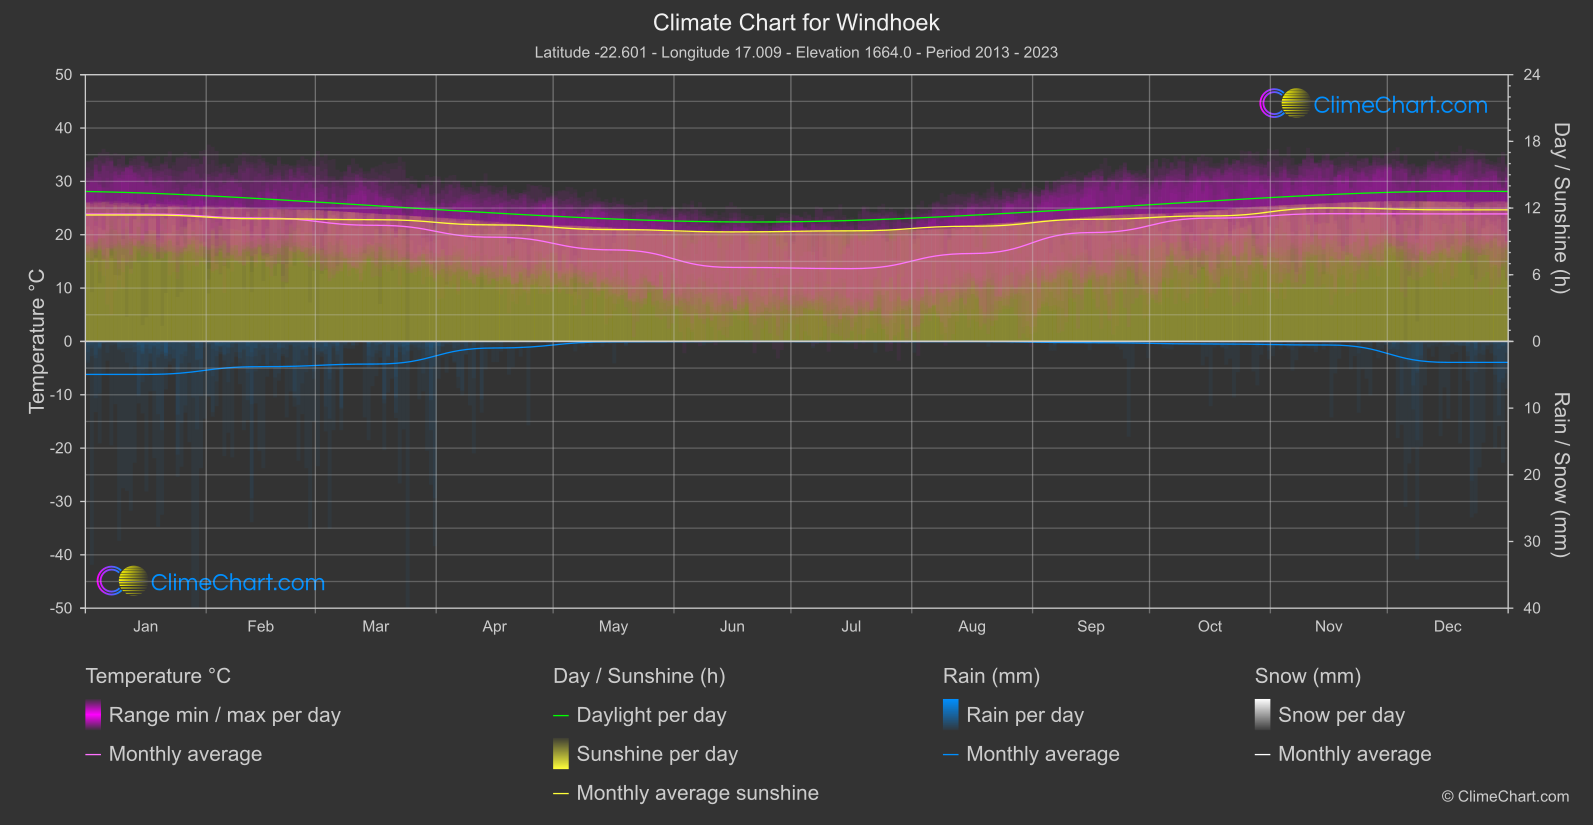
Climate Data Overview for Windhoek, Namibia
Explore the comprehensive climate data for Windhoek, Namibia. This detailed table provides valuable insights into temperature variations, precipitation levels, and seasonal changes, helping you understand the unique weather patterns of this region.
| Month | ⌀ Temperature °C | ⌀ Rain (mm) | ⌀ Snow (mm) | ⌀ Sunshine (h) |
|---|---|---|---|---|
| Jan | 23.9 | 2.47 | 0.00 | 11.38 |
| Feb | 23.1 | 1.89 | 0.00 | 11.04 |
| Mar | 21.8 | 1.70 | 0.00 | 10.95 |
| Apr | 19.5 | 0.49 | 0.00 | 10.48 |
| May | 17.2 | 0.03 | 0.00 | 10.06 |
| Jun | 13.9 | 0.00 | 0.00 | 9.86 |
| Jul | 13.6 | 0.01 | 0.00 | 9.95 |
| Aug | 16.5 | 0.01 | 0.00 | 10.36 |
| Sep | 20.4 | 0.09 | 0.00 | 10.99 |
| Oct | 23.1 | 0.19 | 0.00 | 11.29 |
| Nov | 23.9 | 0.27 | 0.00 | 12.01 |
| Dec | 23.9 | 1.57 | 0.00 | 11.84 |
| ⌀ Month | 20.1 | 0.73 | 0.00 | 10.85 |