Climate Change Chart of Windhoek, Namibia
Comprehensive Climate Change Chart of Windhoek, Namibia: Monthly Averages and Impact Trends
Exploring the changing climate in Windhoek, Namibia reveals significant shifts in temperature, rainfall, and sunshine duration over the years.
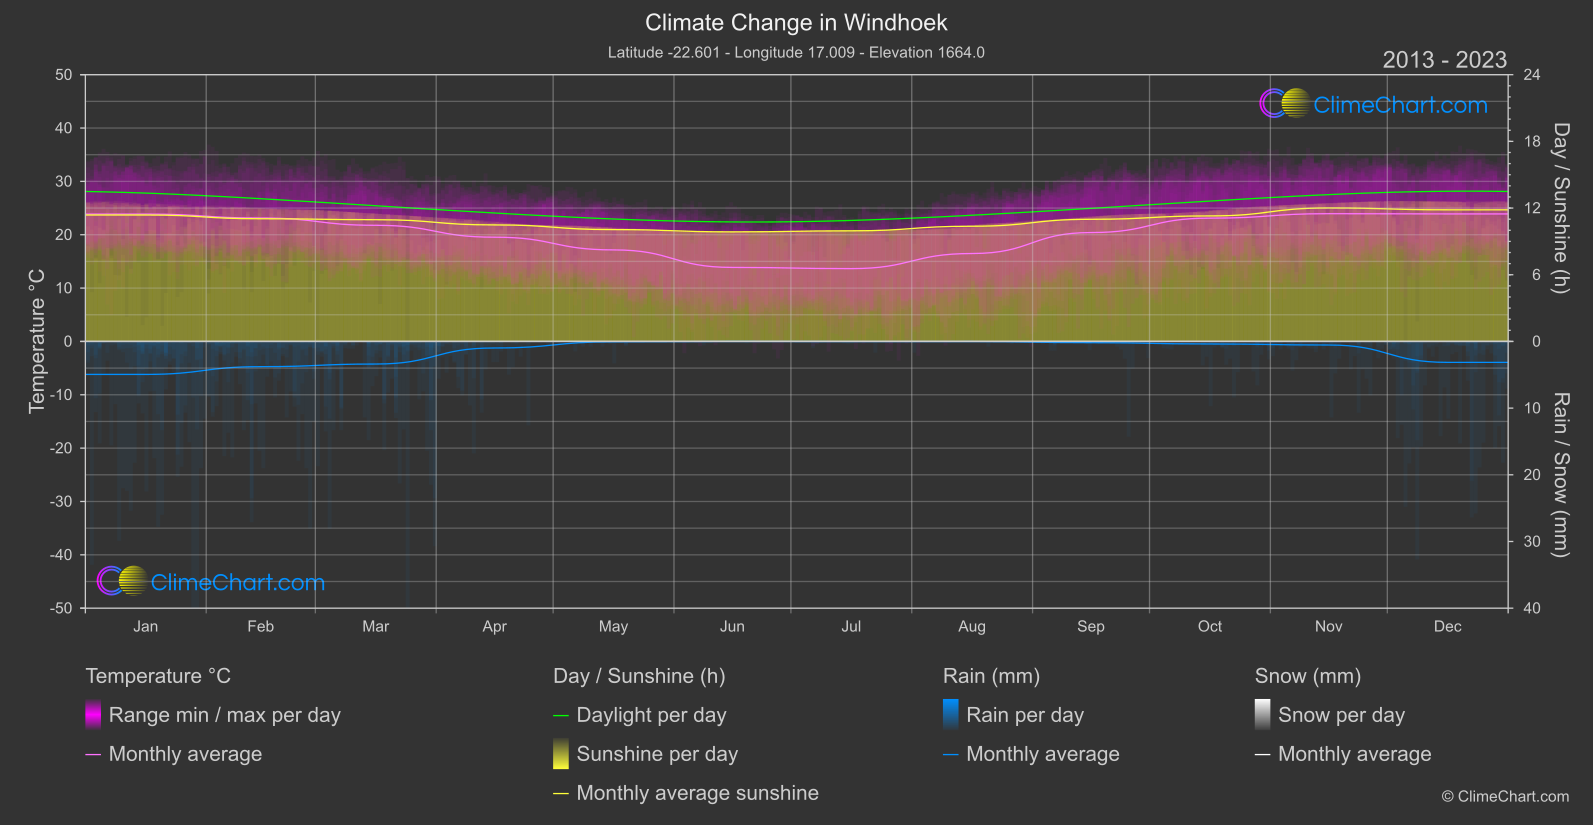
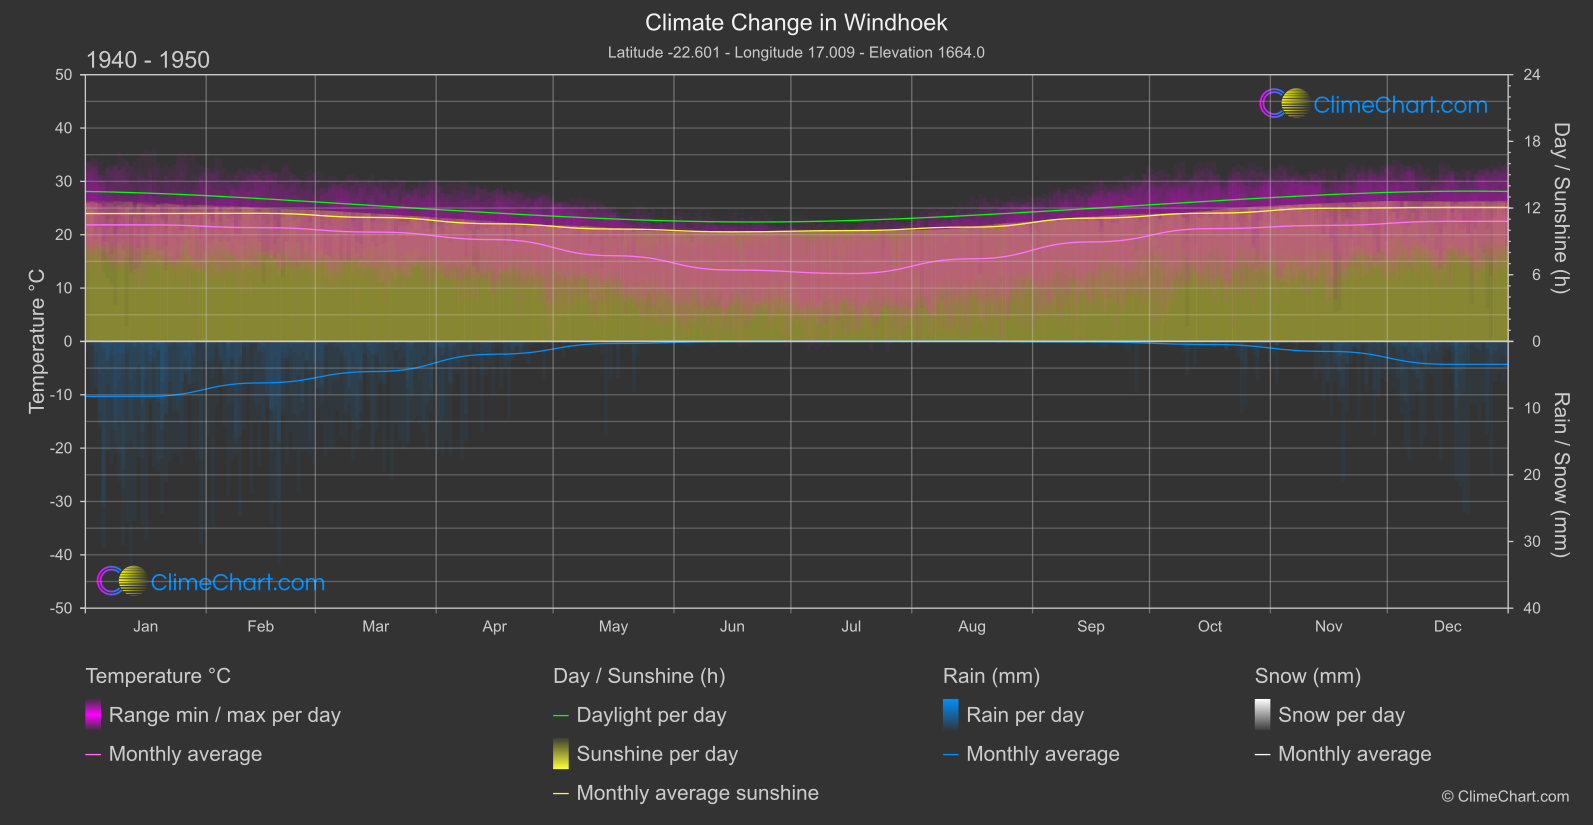
Windhoek, the capital of Namibia, experiences notable changes in climate parameters. From January to December, the data shows a consistent increase in mean temperature from 1940-1950 to 2013-2024. The month with the highest temperature change is November, with an increase of 2.20°C. In terms of rainfall, there is a general decrease in most months, with January showing the largest reduction of 1.65 mm. Sunshine duration also displays variations, with August having the highest increase of 0.08 hours compared to the historical period.
Climate Change Data Overview for Windhoek, Namibia
Explore the comprehensive climate change data for Windhoek, Namibia. This detailed table provides valuable insights into temperature variations, precipitation levels, and seasonal changes influenced by climate change, helping you understand the unique weather patterns of this region.
Temperature °C
| Month | ⌀ 1940 - 1950 | ⌀ 2013 - 2023 | +/- |
|---|---|---|---|
| Jan | 21.85 | 23.87 | 2.02 |
| Feb | 21.33 | 23.13 | 1.80 |
| Mar | 20.49 | 21.77 | 1.28 |
| Apr | 19.08 | 19.54 | 0.46 |
| May | 16.06 | 17.16 | 1.09 |
| Jun | 13.38 | 13.87 | 0.49 |
| Jul | 12.72 | 13.65 | 0.92 |
| Aug | 15.49 | 16.48 | 0.99 |
| Sep | 18.65 | 20.41 | 1.76 |
| Oct | 21.14 | 23.11 | 1.97 |
| Nov | 21.75 | 23.95 | 2.20 |
| Dec | 22.51 | 23.90 | 1.39 |
| ⌀ Month | 18.71 | 20.07 | 1.36 |
Sunshine (h)
| Month | ⌀ 1940 - 1950 | ⌀ 2013 - 2023 | +/- |
|---|---|---|---|
| Jan | 11.51 | 11.38 | -0.13 |
| Feb | 11.53 | 11.04 | -0.49 |
| Mar | 11.15 | 10.95 | -0.20 |
| Apr | 10.59 | 10.48 | -0.11 |
| May | 10.11 | 10.06 | -0.05 |
| Jun | 9.86 | 9.86 | -0.00 |
| Jul | 9.97 | 9.95 | -0.02 |
| Aug | 10.29 | 10.36 | 0.08 |
| Sep | 11.09 | 10.99 | -0.10 |
| Oct | 11.54 | 11.29 | -0.25 |
| Nov | 11.98 | 12.01 | 0.02 |
| Dec | 12.06 | 11.84 | -0.22 |
| ⌀ Month | 10.97 | 10.85 | -0.12 |
Rain (mm)
| Month | ⌀ 1940 - 1950 | ⌀ 2013 - 2023 | +/- |
|---|---|---|---|
| Jan | 4.12 | 2.47 | -1.65 |
| Feb | 3.11 | 1.89 | -1.22 |
| Mar | 2.26 | 1.70 | -0.56 |
| Apr | 0.96 | 0.49 | -0.47 |
| May | 0.15 | 0.03 | -0.12 |
| Jun | 0.01 | 0.00 | -0.01 |
| Jul | 0.00 | 0.01 | 0.01 |
| Aug | 0.00 | 0.01 | 0.01 |
| Sep | 0.04 | 0.09 | 0.05 |
| Oct | 0.23 | 0.19 | -0.04 |
| Nov | 0.75 | 0.27 | -0.48 |
| Dec | 1.71 | 1.57 | -0.14 |
| ⌀ Month | 1.11 | 0.73 | -0.39 |
Snow (mm)
| Month | ⌀ 1940 - 1950 | ⌀ 2013 - 2023 | +/- |
|---|---|---|---|
| Jan | 0.00 | 0.00 | 0.00 |
| Feb | 0.00 | 0.00 | 0.00 |
| Mar | 0.00 | 0.00 | 0.00 |
| Apr | 0.00 | 0.00 | 0.00 |
| May | 0.00 | 0.00 | 0.00 |
| Jun | 0.00 | 0.00 | 0.00 |
| Jul | 0.00 | 0.00 | 0.00 |
| Aug | 0.00 | 0.00 | 0.00 |
| Sep | 0.00 | 0.00 | 0.00 |
| Oct | 0.00 | 0.00 | 0.00 |
| Nov | 0.00 | 0.00 | 0.00 |
| Dec | 0.00 | 0.00 | 0.00 |
| ⌀ Month | 0.00 | 0.00 | 0.00 |