Climate Chart of Willemstad, Curaçao
Comprehensive Climate Chart of Willemstad, Curaçao: Monthly Averages and Weather Trends
Welcome to Willemstad, Curaçao! Discover the climate and weather of this vibrant Caribbean city.
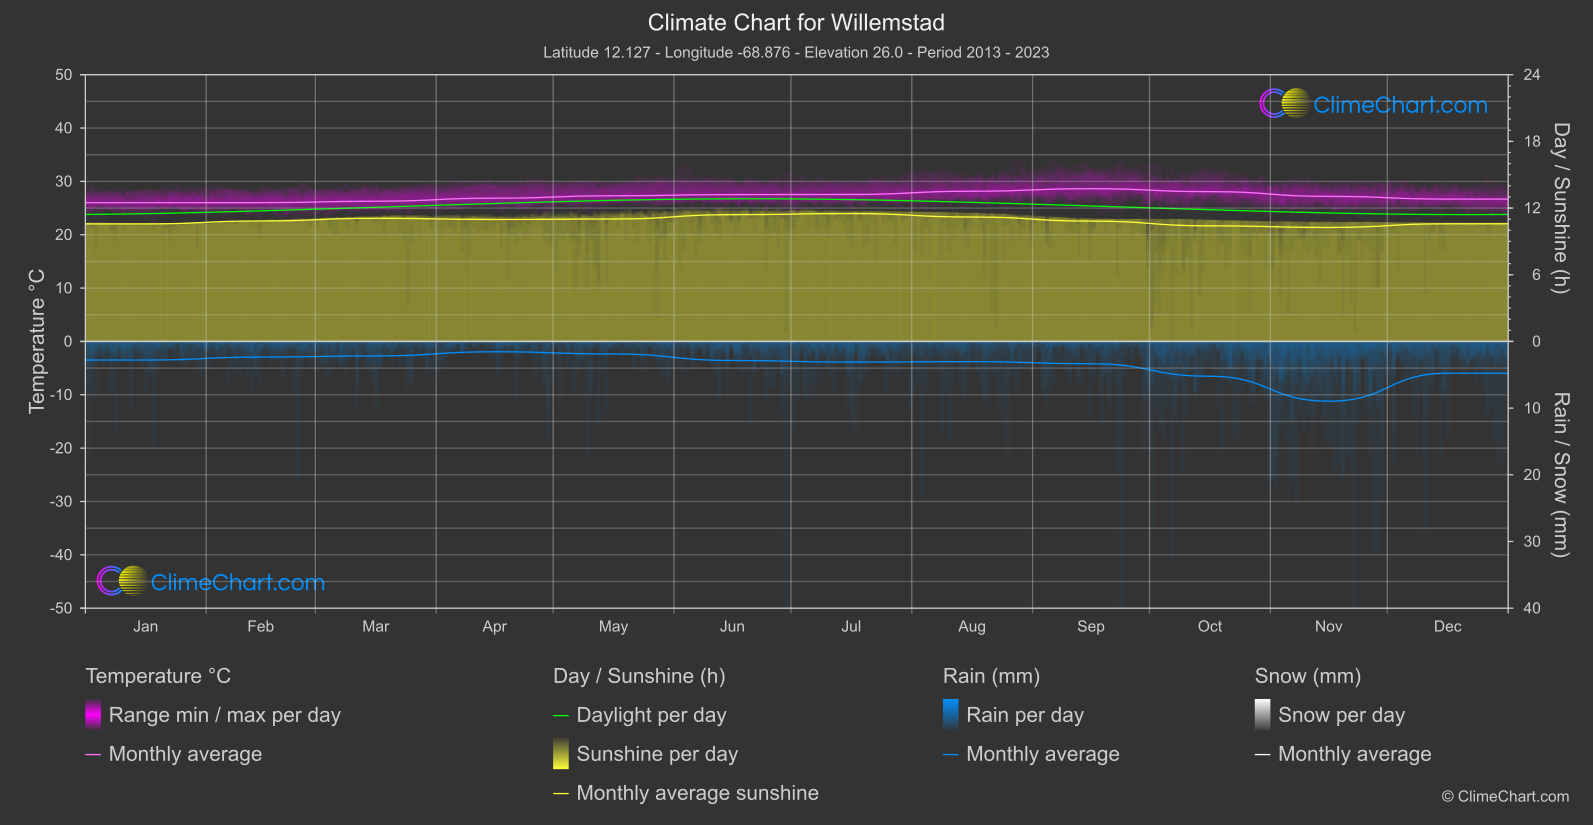
Willemstad, Curaçao enjoys a tropical savanna climate with relatively constant temperatures throughout the year. The average temperature ranges from 77°F to 88°F (25°C to 31°C). The city experiences a distinct wet season from October to December, with the highest rainfall occurring in November. The dry season extends from January to September, with June being the driest month. Trade winds help moderate the heat and humidity in Willemstad.
Best Travel Time Guide for Willemstad, Curaçao: Ideal Seasons and Weather Insights
The best time to travel to Willemstad, Curaçao is during the dry season, from January to September, when the weather is sunny and rainfall is minimal. June is an ideal month for those seeking clear skies and outdoor activities. Avoid visiting during the wet season, especially in November when heavy rainfall can occur.
Climate Data Overview for Willemstad, Curaçao
Explore the comprehensive climate data for Willemstad, Curaçao. This detailed table provides valuable insights into temperature variations, precipitation levels, and seasonal changes, helping you understand the unique weather patterns of this region.
| Month | ⌀ Temperature °C | ⌀ Rain (mm) | ⌀ Snow (mm) | ⌀ Sunshine (h) |
|---|---|---|---|---|
| Jan | 26.0 | 1.39 | 0.00 | 10.57 |
| Feb | 26.0 | 1.17 | 0.00 | 10.84 |
| Mar | 26.3 | 1.09 | 0.00 | 11.08 |
| Apr | 26.8 | 0.77 | 0.00 | 10.97 |
| May | 27.3 | 0.94 | 0.00 | 11.01 |
| Jun | 27.5 | 1.43 | 0.00 | 11.40 |
| Jul | 27.5 | 1.55 | 0.00 | 11.50 |
| Aug | 28.2 | 1.51 | 0.00 | 11.19 |
| Sep | 28.6 | 1.67 | 0.00 | 10.83 |
| Oct | 28.1 | 2.61 | 0.00 | 10.40 |
| Nov | 27.2 | 4.48 | 0.00 | 10.26 |
| Dec | 26.7 | 2.38 | 0.00 | 10.58 |
| ⌀ Month | 27.2 | 1.75 | 0.00 | 10.89 |