Climate Change Chart of Willemstad, Curaçao
Comprehensive Climate Change Chart of Willemstad, Curaçao: Monthly Averages and Impact Trends
Exploring the changing climate in Willemstad, Curaçao reveals significant shifts in temperature, rainfall, and sunshine duration over the years. Dive into the data to uncover intriguing insights.
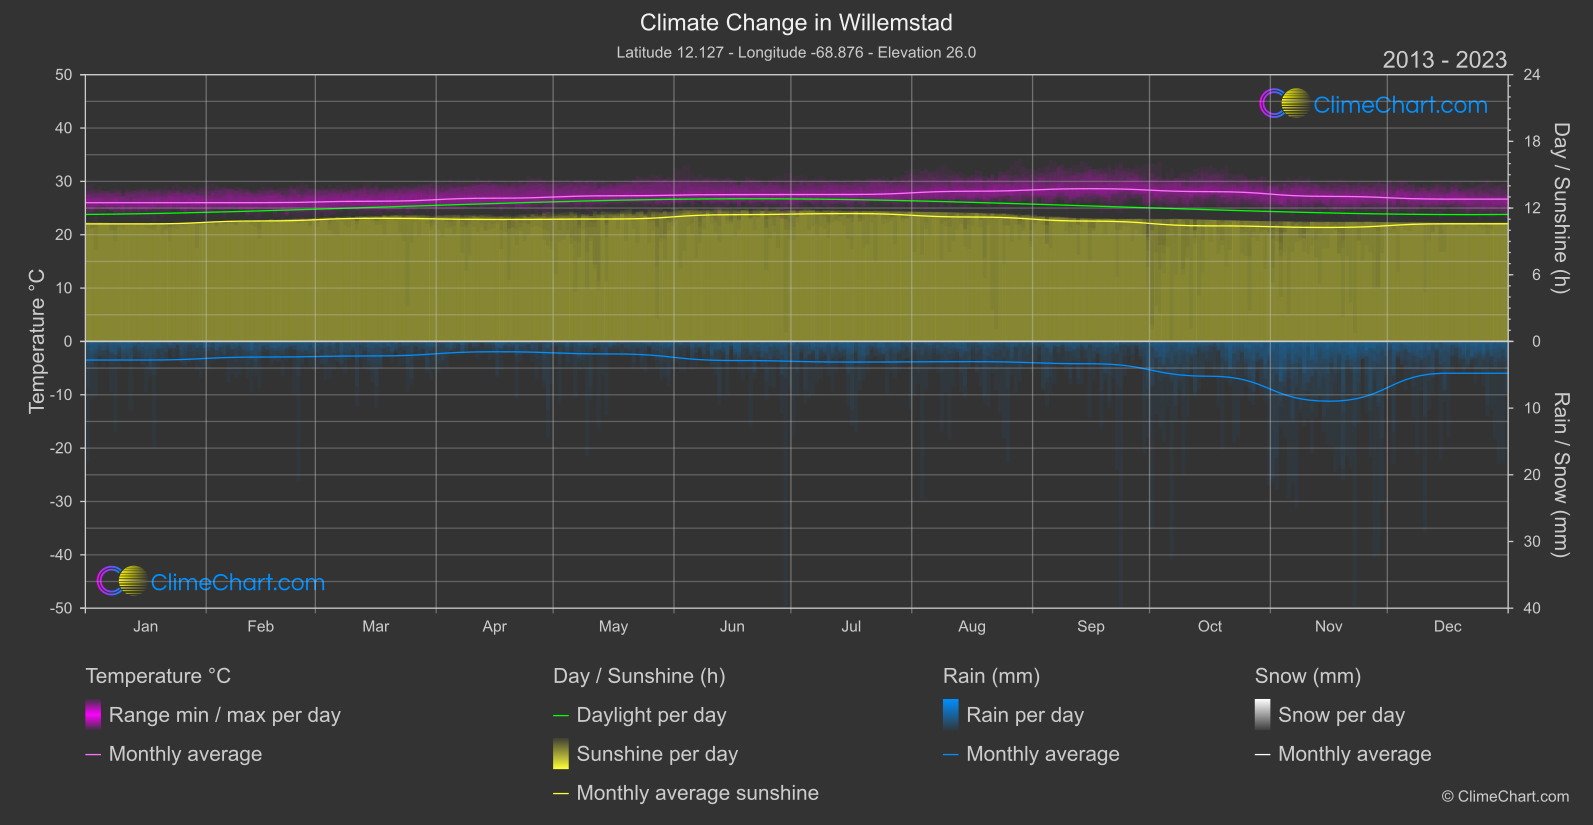
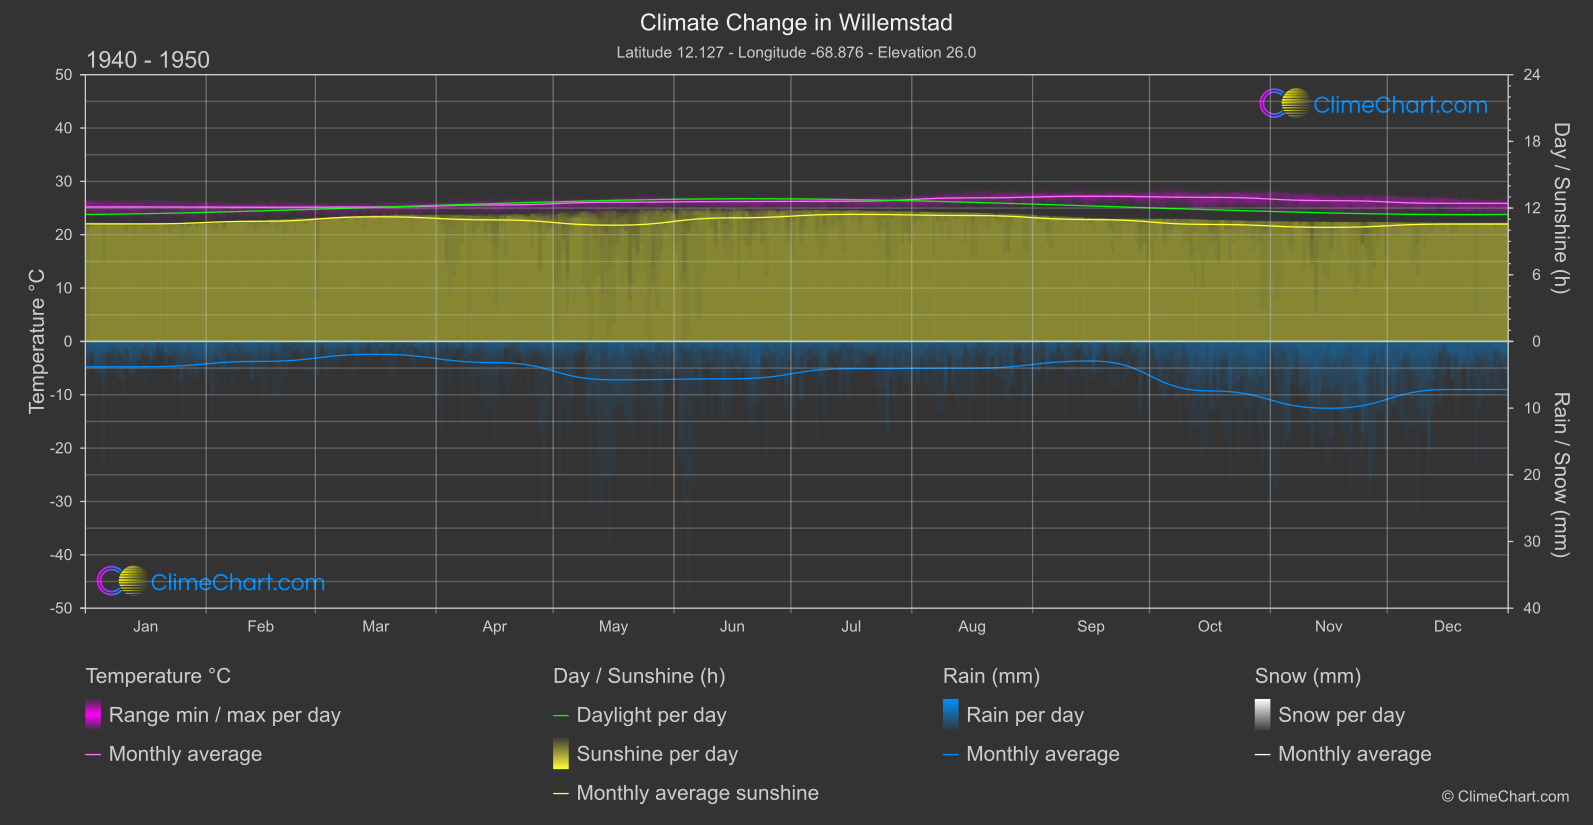
Willemstad, Curaçao experiences a noticeable increase in temperature from 1940-1950 to 2013-2024 across all months. Interestingly, September shows the highest temperature change of approximately 1.41°C. In terms of rainfall, a general decrease is observed, with May having the most significant decline of around 1.94 mm. The sunshine duration also displays variations, with May showing the highest increase of about 0.56 hours.
Climate Change Data Overview for Willemstad, Curaçao
Explore the comprehensive climate change data for Willemstad, Curaçao. This detailed table provides valuable insights into temperature variations, precipitation levels, and seasonal changes influenced by climate change, helping you understand the unique weather patterns of this region.
Temperature °C
| Month | ⌀ 1940 - 1950 | ⌀ 2013 - 2023 | +/- |
|---|---|---|---|
| Jan | 25.21 | 26.01 | 0.79 |
| Feb | 25.16 | 26.01 | 0.85 |
| Mar | 25.20 | 26.28 | 1.08 |
| Apr | 25.58 | 26.85 | 1.27 |
| May | 26.09 | 27.30 | 1.21 |
| Jun | 26.22 | 27.52 | 1.30 |
| Jul | 26.29 | 27.55 | 1.26 |
| Aug | 26.91 | 28.16 | 1.24 |
| Sep | 27.21 | 28.63 | 1.41 |
| Oct | 27.01 | 28.08 | 1.07 |
| Nov | 26.40 | 27.19 | 0.79 |
| Dec | 25.88 | 26.68 | 0.80 |
| ⌀ Month | 26.10 | 27.19 | 1.09 |
Sunshine (h)
| Month | ⌀ 1940 - 1950 | ⌀ 2013 - 2023 | +/- |
|---|---|---|---|
| Jan | 10.58 | 10.57 | -0.00 |
| Feb | 10.81 | 10.84 | 0.03 |
| Mar | 11.21 | 11.08 | -0.13 |
| Apr | 10.94 | 10.97 | 0.04 |
| May | 10.46 | 11.01 | 0.56 |
| Jun | 11.12 | 11.40 | 0.29 |
| Jul | 11.43 | 11.50 | 0.07 |
| Aug | 11.33 | 11.19 | -0.13 |
| Sep | 10.97 | 10.83 | -0.14 |
| Oct | 10.53 | 10.40 | -0.13 |
| Nov | 10.26 | 10.26 | -0.01 |
| Dec | 10.56 | 10.58 | 0.02 |
| ⌀ Month | 10.85 | 10.89 | 0.04 |
Rain (mm)
| Month | ⌀ 1940 - 1950 | ⌀ 2013 - 2023 | +/- |
|---|---|---|---|
| Jan | 1.90 | 1.39 | -0.50 |
| Feb | 1.50 | 1.17 | -0.32 |
| Mar | 0.96 | 1.09 | 0.13 |
| Apr | 1.58 | 0.77 | -0.81 |
| May | 2.88 | 0.94 | -1.94 |
| Jun | 2.80 | 1.43 | -1.37 |
| Jul | 2.04 | 1.55 | -0.49 |
| Aug | 2.00 | 1.51 | -0.49 |
| Sep | 1.47 | 1.67 | 0.20 |
| Oct | 3.71 | 2.61 | -1.10 |
| Nov | 5.01 | 4.48 | -0.53 |
| Dec | 3.60 | 2.38 | -1.22 |
| ⌀ Month | 2.45 | 1.75 | -0.70 |
Snow (mm)
| Month | ⌀ 1940 - 1950 | ⌀ 2013 - 2023 | +/- |
|---|---|---|---|
| Jan | 0.00 | 0.00 | 0.00 |
| Feb | 0.00 | 0.00 | 0.00 |
| Mar | 0.00 | 0.00 | 0.00 |
| Apr | 0.00 | 0.00 | 0.00 |
| May | 0.00 | 0.00 | 0.00 |
| Jun | 0.00 | 0.00 | 0.00 |
| Jul | 0.00 | 0.00 | 0.00 |
| Aug | 0.00 | 0.00 | 0.00 |
| Sep | 0.00 | 0.00 | 0.00 |
| Oct | 0.00 | 0.00 | 0.00 |
| Nov | 0.00 | 0.00 | 0.00 |
| Dec | 0.00 | 0.00 | 0.00 |
| ⌀ Month | 0.00 | 0.00 | 0.00 |