Climate Chart of Tulum, Mexico
Comprehensive Climate Chart of Tulum, Mexico: Monthly Averages and Weather Trends
Discover the Climate of Tulum, Mexico
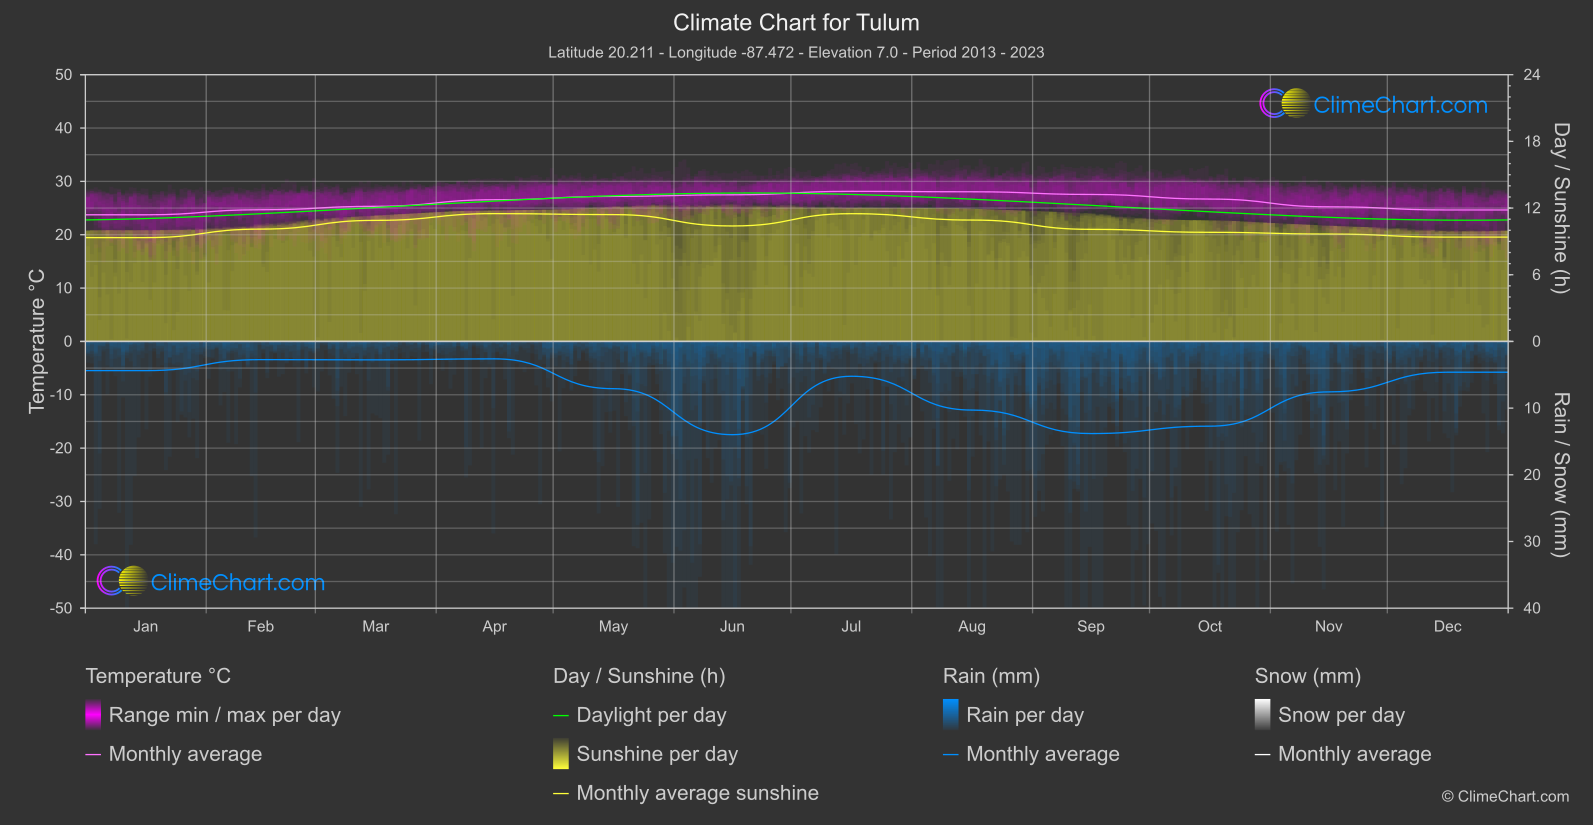
Tulum, Mexico enjoys a tropical climate with warm temperatures throughout the year. The average temperature ranges from 75°F to 85°F (24°C to 29°C). The rainy season typically occurs from May to October, with the possibility of hurricanes in the late summer months. The dry season runs from November to April, offering pleasant weather and clear skies.
Best Travel Time Guide for Tulum, Mexico: Ideal Seasons and Weather Insights
The best time to visit Tulum is during the dry season from November to April when the weather is pleasant and ideal for outdoor activities. However, if you prefer fewer crowds, consider traveling during the shoulder seasons of May to October, keeping in mind the possibility of rain showers.
Climate Data Overview for Tulum, Mexico
Explore the comprehensive climate data for Tulum, Mexico. This detailed table provides valuable insights into temperature variations, precipitation levels, and seasonal changes, helping you understand the unique weather patterns of this region.
| Month | ⌀ Temperature °C | ⌀ Rain (mm) | ⌀ Snow (mm) | ⌀ Sunshine (h) |
|---|---|---|---|---|
| Jan | 23.7 | 2.19 | 0.00 | 9.34 |
| Feb | 24.7 | 1.36 | 0.00 | 10.11 |
| Mar | 25.3 | 1.38 | 0.00 | 10.89 |
| Apr | 26.6 | 1.31 | 0.00 | 11.50 |
| May | 27.2 | 3.54 | 0.00 | 11.41 |
| Jun | 27.5 | 6.99 | 0.00 | 10.39 |
| Jul | 28.1 | 2.61 | 0.00 | 11.49 |
| Aug | 28.1 | 5.15 | 0.00 | 10.92 |
| Sep | 27.6 | 6.91 | 0.00 | 10.08 |
| Oct | 26.7 | 6.35 | 0.00 | 9.82 |
| Nov | 25.2 | 3.78 | 0.00 | 9.66 |
| Dec | 24.6 | 2.31 | 0.00 | 9.39 |
| ⌀ Month | 26.3 | 3.66 | 0.00 | 10.42 |