Climate Chart of Tijuana, Mexico
Monthly data: Temperature °C, Rain (mm), Sunshine (h) · 2013–2023
Discover the climate of Tijuana, Mexico
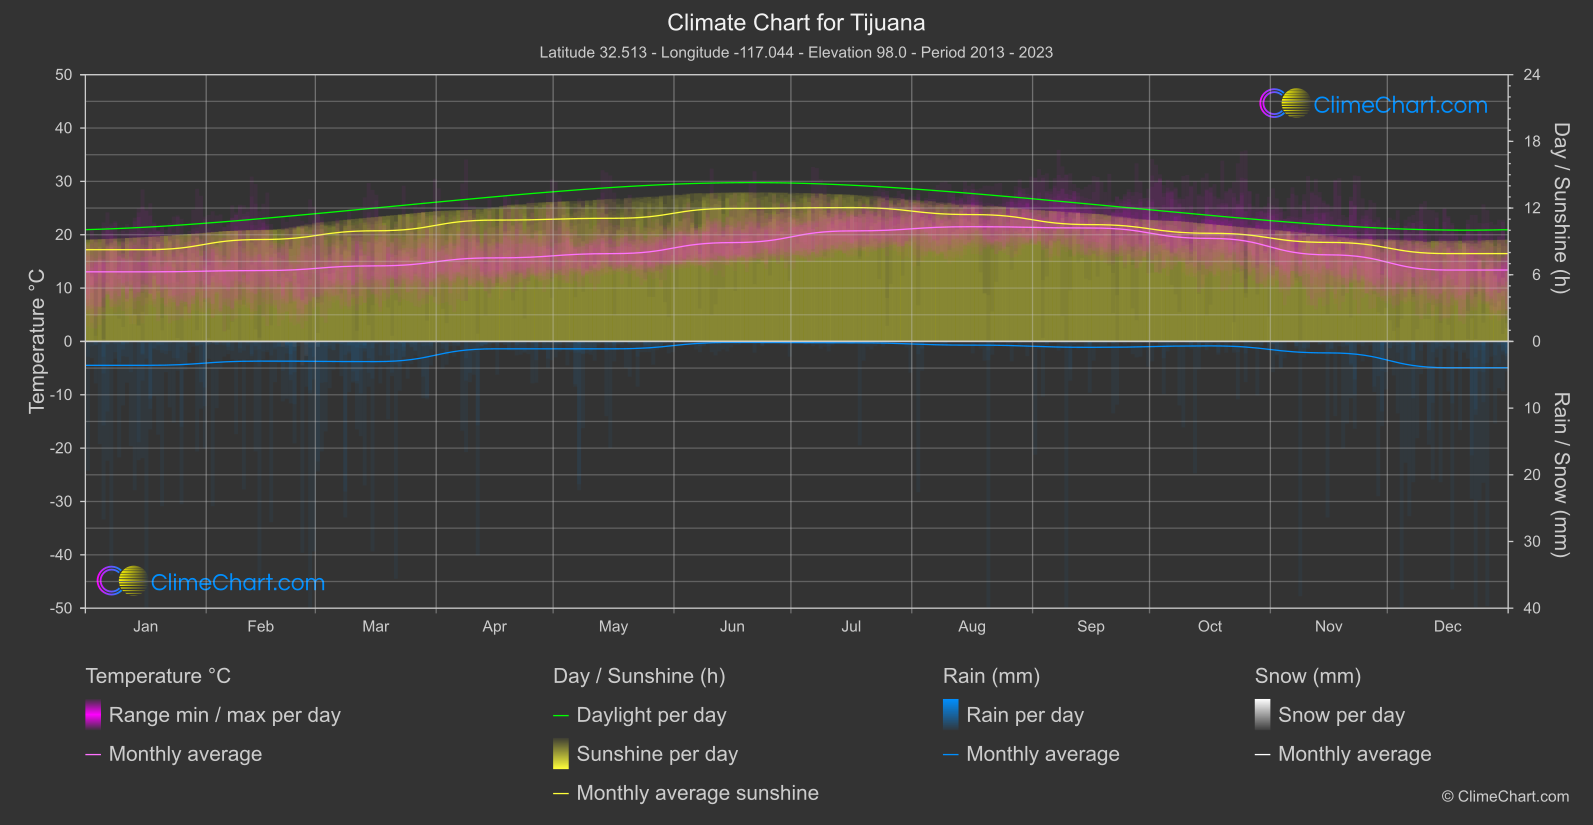
Climate overview
Temperature
Tijuana, located in Mexico, experiences a Mediterranean climate with dry, warm summers and mild winters. The average temperature ranges from 14°C to 24°C throughout the year.
Rain
The city receives most of its rainfall during the winter months, while summers are generally dry.
Sunshine
Tijuana is known for its pleasant weather and sunny days, making it an ideal destination for travelers seeking a comfortable climate.
Best Travel Time Guide for Tijuana, Mexico: Ideal Seasons and Weather Insights
The best time to travel to Tijuana is during the spring and fall seasons when the weather is mild and pleasant. These months offer comfortable temperatures and are ideal for exploring the city's attractions and outdoor activities. Summer can be hot, so visitors should be prepared for warmer temperatures. Winter, although mild, can be wet, so it's advisable to pack accordingly. Overall, Tijuana is a year-round destination with something to offer every season.
Climate Data Overview for Tijuana, Mexico
Explore the comprehensive climate data for Tijuana, Mexico. This detailed table provides valuable insights into temperature variations, precipitation levels, and seasonal changes, helping you understand the unique weather patterns of this region.
| Month | Average: Temperature °C | Rain (mm) / day | Snow (mm) / day | Sunshine (h) / day |
|---|---|---|---|---|
| Jan | 13.0 | 1.79 | 0.00 | 8.25 |
| Feb | 13.3 | 1.48 | 0.02 | 9.17 |
| Mar | 14.2 | 1.51 | 0.00 | 9.95 |
| Apr | 15.7 | 0.55 | 0.00 | 10.92 |
| May | 16.5 | 0.55 | 0.00 | 11.08 |
| Jun | 18.5 | 0.08 | 0.00 | 11.96 |
| Jul | 20.7 | 0.10 | 0.00 | 12.04 |
| Aug | 21.5 | 0.28 | 0.00 | 11.41 |
| Sep | 21.3 | 0.44 | 0.00 | 10.51 |
| Oct | 19.3 | 0.33 | 0.00 | 9.73 |
| Nov | 16.2 | 0.86 | 0.00 | 8.91 |
| Dec | 13.4 | 1.97 | 0.00 | 7.90 |
| Average | 17.0 | 0.83 | 0.00 | 10.15 |