Climate Change Chart of Tijuana, Mexico
Comprehensive Climate Change Chart of Tijuana, Mexico: Monthly Averages and Impact Trends
Exploring the changing climate in Tijuana, Mexico reveals significant shifts in temperature, rainfall, snowfall, and sunshine duration over the years. Dive into the data to uncover insightful trends.
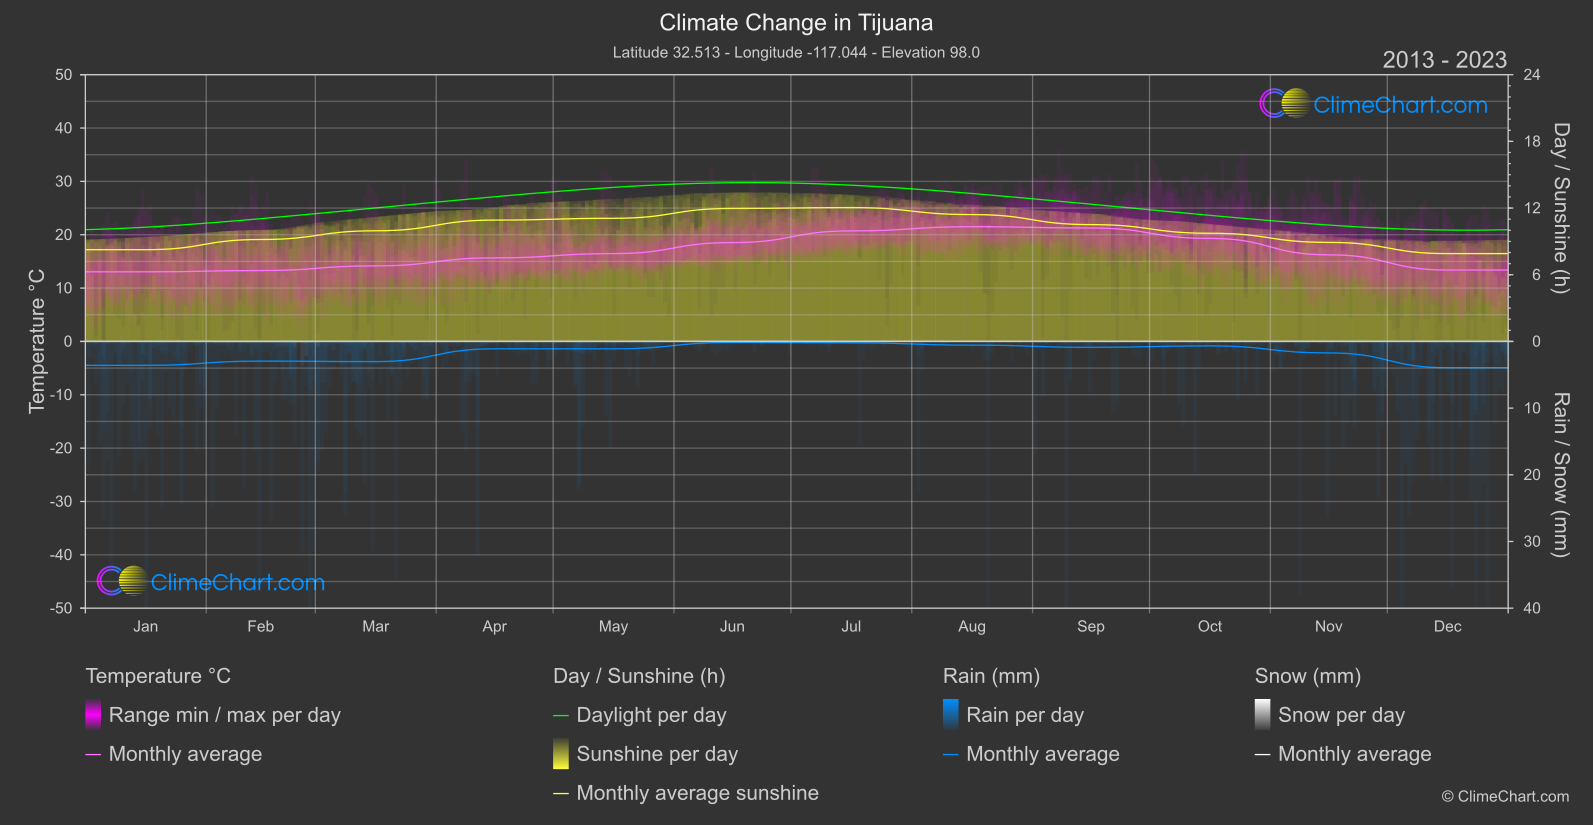
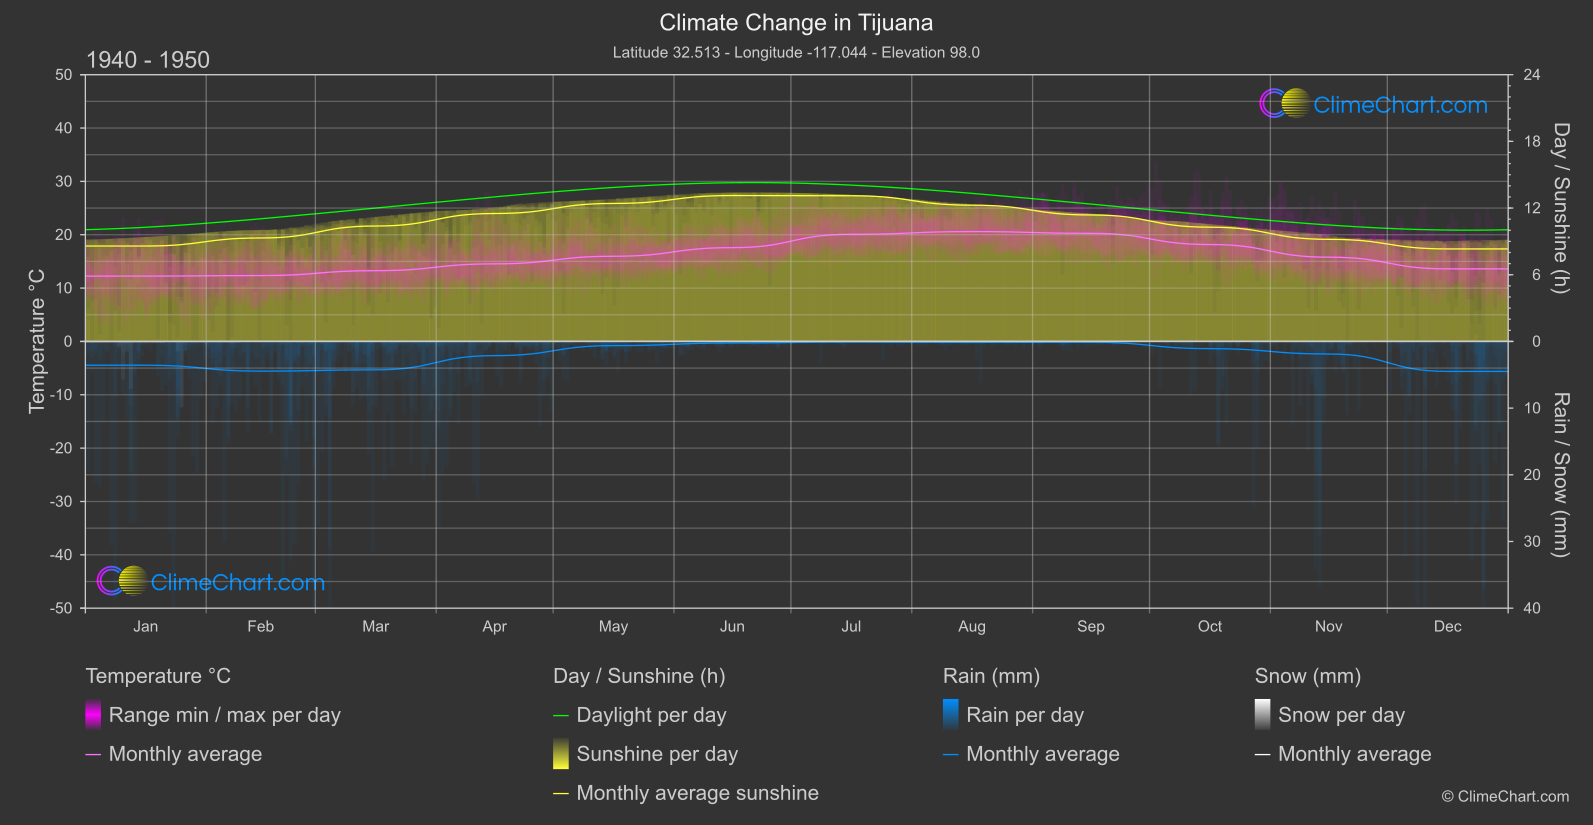
Tijuana, Mexico experiences notable changes in climate parameters. The data showcases temperature increases across most months, with October showing the highest rise. Rainfall patterns indicate varying trends, with a significant decrease in February. Snowfall remains minimal throughout the years. Sunshine duration fluctuates, with May experiencing the most substantial decrease.
Climate Change Data Overview for Tijuana, Mexico
Explore the comprehensive climate change data for Tijuana, Mexico. This detailed table provides valuable insights into temperature variations, precipitation levels, and seasonal changes influenced by climate change, helping you understand the unique weather patterns of this region.
Temperature °C
| Month | ⌀ 1940 - 1950 | ⌀ 2013 - 2023 | +/- |
|---|---|---|---|
| Jan | 12.24 | 13.04 | 0.80 |
| Feb | 12.35 | 13.29 | 0.94 |
| Mar | 13.26 | 14.17 | 0.90 |
| Apr | 14.54 | 15.66 | 1.12 |
| May | 15.96 | 16.46 | 0.50 |
| Jun | 17.58 | 18.53 | 0.95 |
| Jul | 20.08 | 20.72 | 0.64 |
| Aug | 20.59 | 21.51 | 0.92 |
| Sep | 20.26 | 21.26 | 1.00 |
| Oct | 18.17 | 19.31 | 1.15 |
| Nov | 15.79 | 16.23 | 0.44 |
| Dec | 13.60 | 13.38 | -0.22 |
| ⌀ Month | 16.20 | 16.96 | 0.76 |
Sunshine (h)
| Month | ⌀ 1940 - 1950 | ⌀ 2013 - 2023 | +/- |
|---|---|---|---|
| Jan | 8.58 | 8.25 | -0.33 |
| Feb | 9.31 | 9.17 | -0.14 |
| Mar | 10.38 | 9.95 | -0.43 |
| Apr | 11.51 | 10.92 | -0.59 |
| May | 12.41 | 11.08 | -1.34 |
| Jun | 13.13 | 11.96 | -1.16 |
| Jul | 13.11 | 12.04 | -1.06 |
| Aug | 12.26 | 11.41 | -0.85 |
| Sep | 11.38 | 10.51 | -0.87 |
| Oct | 10.28 | 9.73 | -0.55 |
| Nov | 9.19 | 8.91 | -0.28 |
| Dec | 8.32 | 7.90 | -0.42 |
| ⌀ Month | 10.82 | 10.15 | -0.67 |
Rain (mm)
| Month | ⌀ 1940 - 1950 | ⌀ 2013 - 2023 | +/- |
|---|---|---|---|
| Jan | 1.78 | 1.79 | 0.01 |
| Feb | 2.23 | 1.48 | -0.75 |
| Mar | 2.13 | 1.51 | -0.62 |
| Apr | 1.06 | 0.55 | -0.51 |
| May | 0.31 | 0.55 | 0.24 |
| Jun | 0.12 | 0.08 | -0.04 |
| Jul | 0.04 | 0.10 | 0.06 |
| Aug | 0.07 | 0.28 | 0.20 |
| Sep | 0.06 | 0.44 | 0.38 |
| Oct | 0.54 | 0.33 | -0.20 |
| Nov | 0.94 | 0.86 | -0.08 |
| Dec | 2.25 | 1.97 | -0.28 |
| ⌀ Month | 0.96 | 0.83 | -0.13 |
Snow (mm)
| Month | ⌀ 1940 - 1950 | ⌀ 2013 - 2023 | +/- |
|---|---|---|---|
| Jan | 0.01 | 0.00 | -0.01 |
| Feb | 0.00 | 0.00 | 0.00 |
| Mar | 0.00 | 0.00 | 0.00 |
| Apr | 0.00 | 0.00 | 0.00 |
| May | 0.00 | 0.00 | 0.00 |
| Jun | 0.00 | 0.00 | 0.00 |
| Jul | 0.00 | 0.00 | 0.00 |
| Aug | 0.00 | 0.00 | 0.00 |
| Sep | 0.00 | 0.00 | 0.00 |
| Oct | 0.00 | 0.00 | 0.00 |
| Nov | 0.00 | 0.00 | 0.00 |
| Dec | 0.00 | 0.00 | 0.00 |
| ⌀ Month | 0.00 | 0.00 | -0.00 |