Climate Chart of St. Thomas, Virgin Islands (U.S.)
Comprehensive Climate Chart of St. Thomas, Virgin Islands (U.S.): Monthly Averages and Weather Trends
St. Thomas, Virgin Islands (U.S.) is a beautiful tropical destination known for its stunning beaches, crystal-clear waters, and vibrant culture. The island enjoys a warm and sunny climate throughout the year, making it a popular choice for tourists seeking a relaxing getaway.
St. Thomas experiences a tropical savanna climate characterized by warm temperatures and relatively consistent weather year-round. The island has a rainy season from September to November, with occasional hurricanes. The dry season runs from December to March, offering pleasant weather for outdoor activities.
Best Travel Time Guide for St. Thomas, Virgin Islands (U.S.): Ideal Seasons and Weather Insights
The best time to travel to St. Thomas is during the dry season from December to March when the weather is most pleasant and ideal for outdoor activities. Avoid visiting during the hurricane season from June to November to ensure a safe and enjoyable trip.
Climate Data Overview for St. Thomas, Virgin Islands (U.S.)
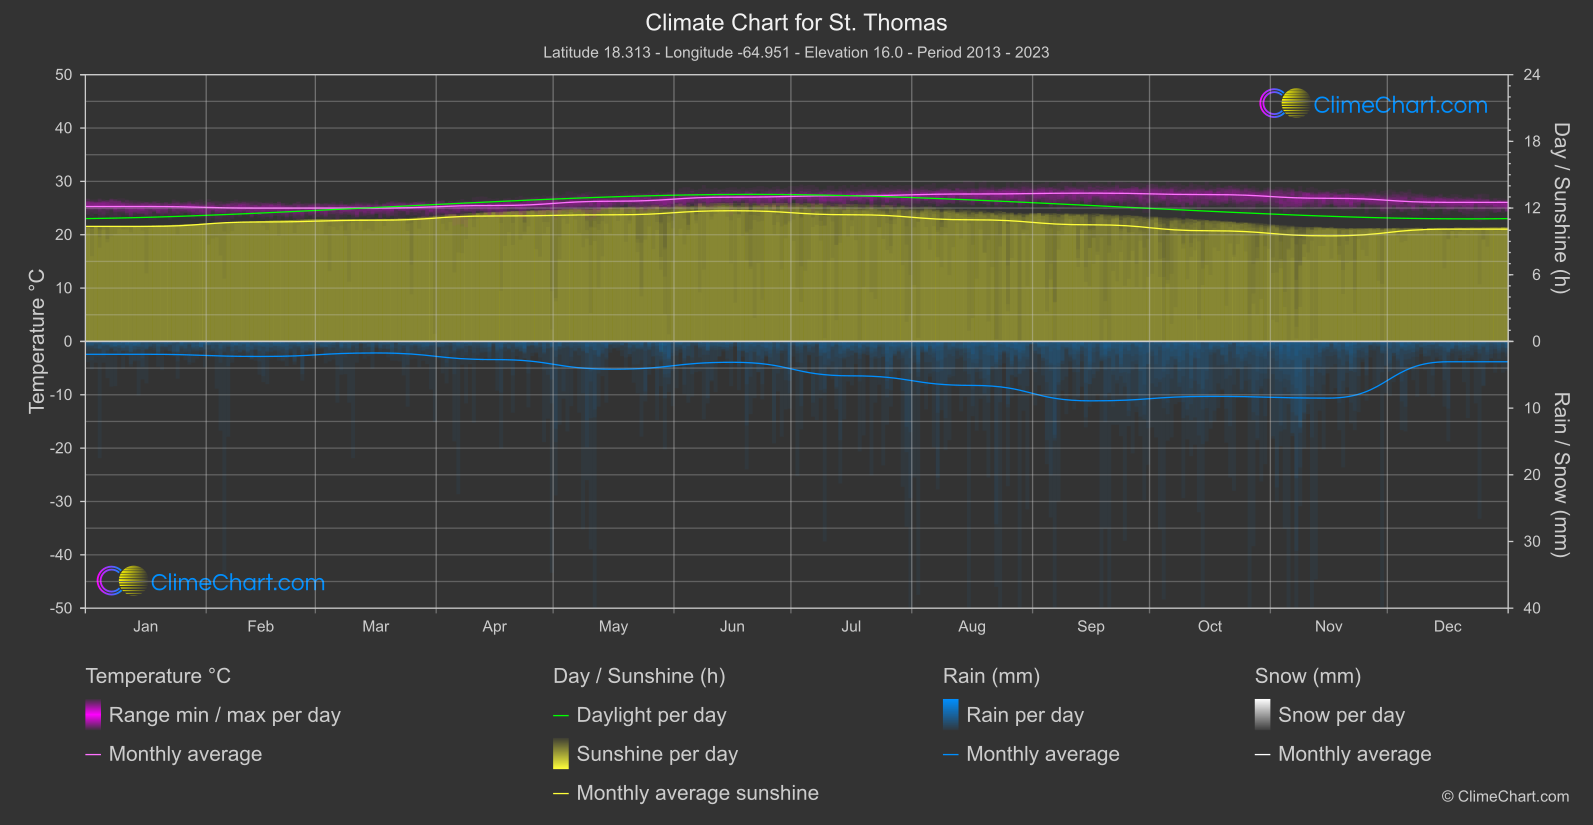
Explore the comprehensive climate data for St. Thomas, Virgin Islands (U.S.). This detailed table provides valuable insights into temperature variations, precipitation levels, and seasonal changes, helping you understand the unique weather patterns of this region.
| Month | ⌀ Temperature °C | ⌀ Rain (mm) | ⌀ Snow (mm) | ⌀ Sunshine (h) |
|---|---|---|---|---|
| Jan | 25.3 | 0.96 | 0.00 | 10.35 |
| Feb | 25.0 | 1.13 | 0.00 | 10.75 |
| Mar | 25.0 | 0.87 | 0.00 | 10.91 |
| Apr | 25.5 | 1.36 | 0.00 | 11.29 |
| May | 26.3 | 2.08 | 0.00 | 11.39 |
| Jun | 27.0 | 1.56 | 0.00 | 11.76 |
| Jul | 27.3 | 2.58 | 0.00 | 11.40 |
| Aug | 27.6 | 3.30 | 0.00 | 10.94 |
| Sep | 27.8 | 4.46 | 0.00 | 10.49 |
| Oct | 27.5 | 4.12 | 0.00 | 9.96 |
| Nov | 26.8 | 4.25 | 0.00 | 9.50 |
| Dec | 26.1 | 1.52 | 0.00 | 10.10 |
| ⌀ Month | 26.4 | 2.35 | 0.00 | 10.74 |