Climate Change Chart of St. Thomas, Virgin Islands (U.S.)
Comprehensive Climate Change Chart of St. Thomas, Virgin Islands (U.S.): Monthly Averages and Impact Trends
Exploring the changing climate in St. Thomas, Virgin Islands (U.S.) reveals intriguing insights.
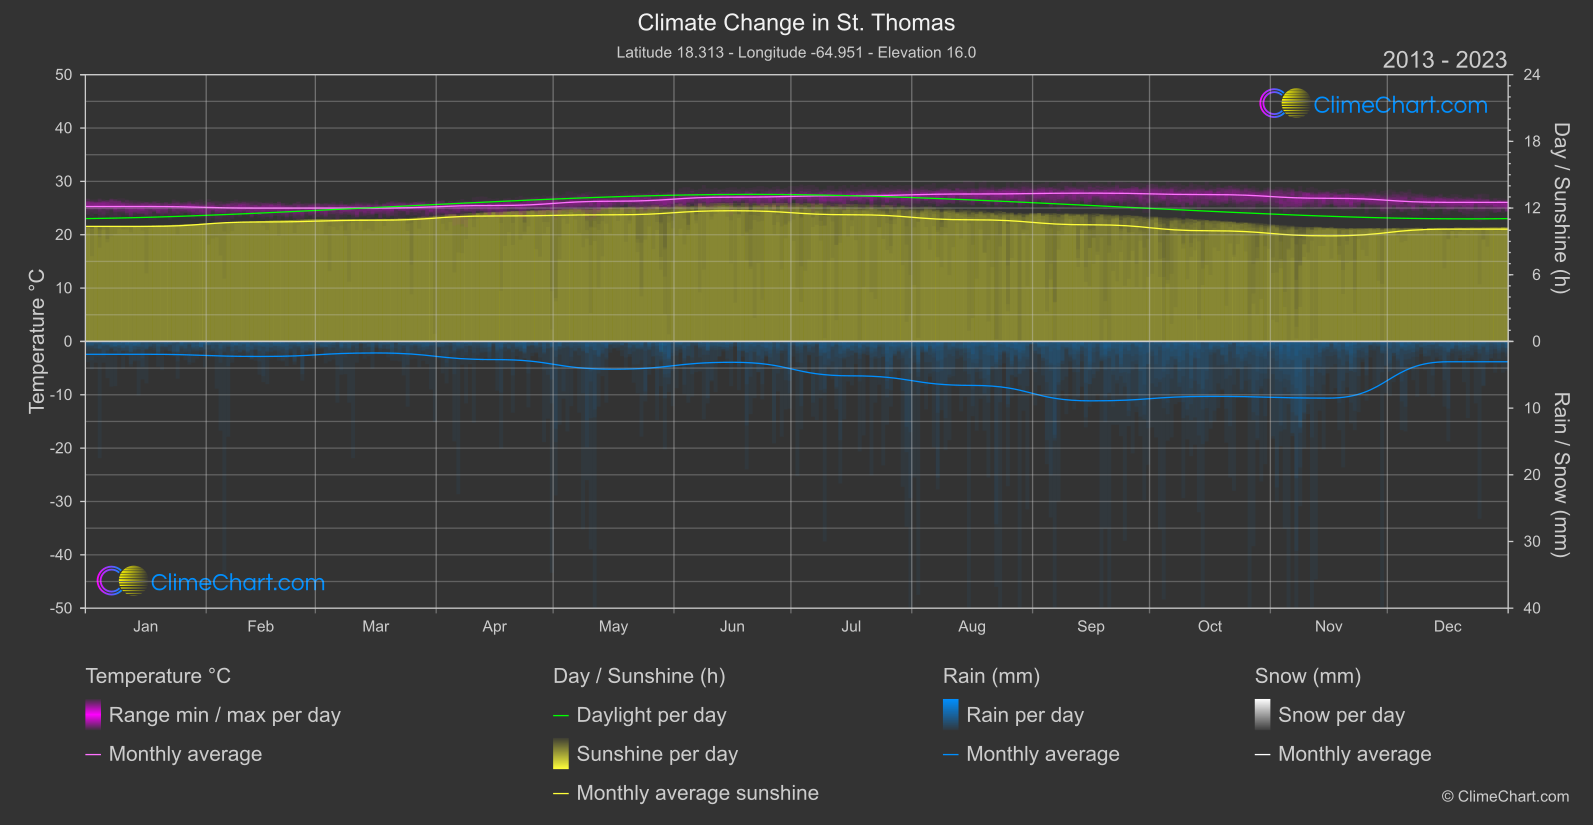
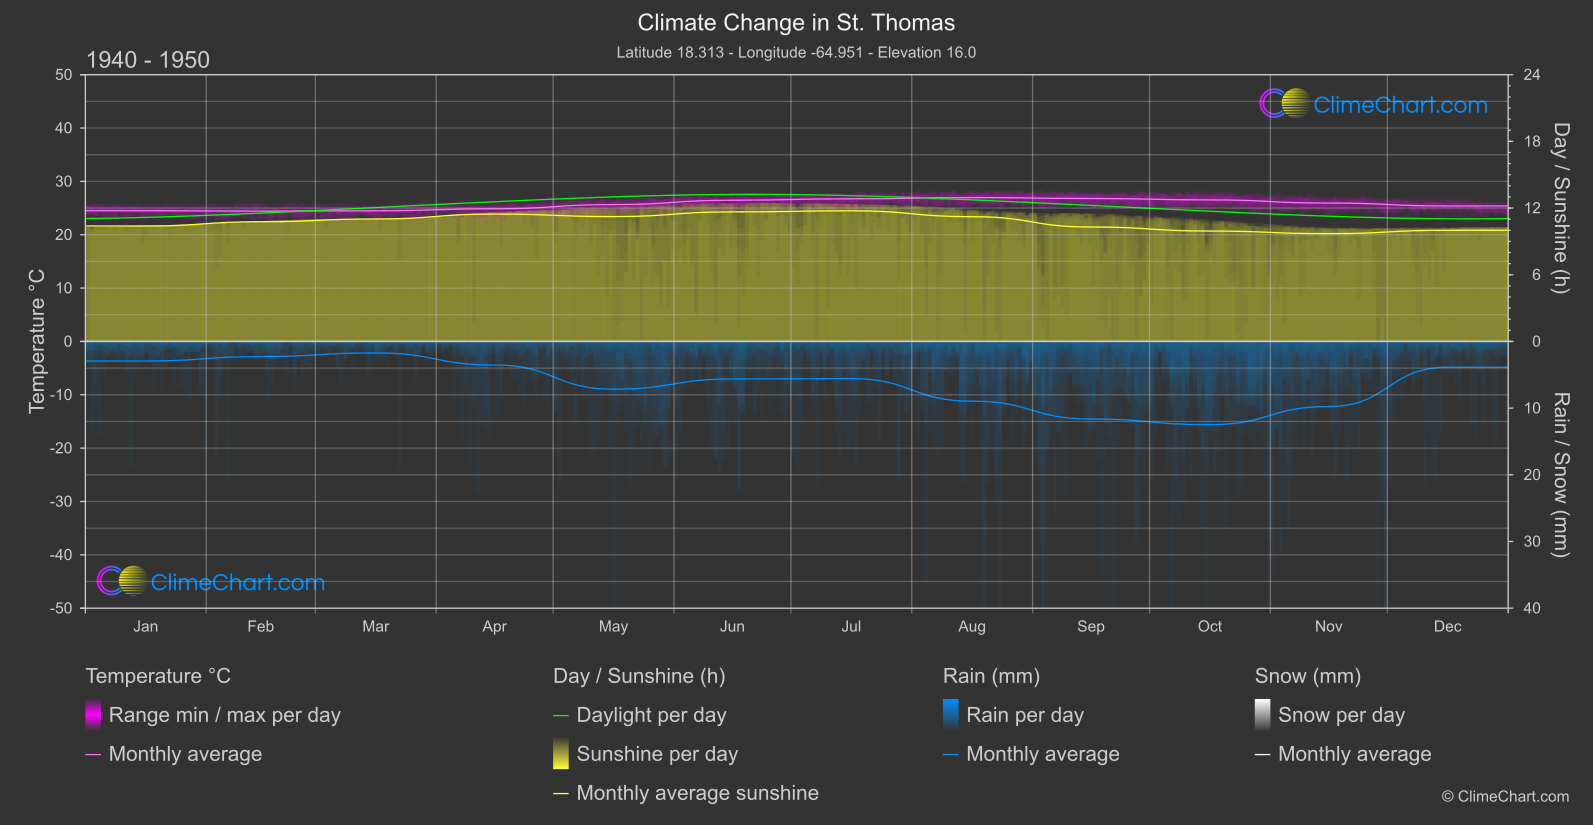
St. Thomas, Virgin Islands (U.S.), has experienced notable changes in temperature, rainfall, and sunshine duration over the years. Among the insights from the data is the month of September showing the highest temperature increase of over 1 degree Celsius compared to the historical period. Additionally, the data highlights significant decreases in rainfall across several months, with October witnessing the most substantial decrease of over 2 millimeters. Sunshine duration also fluctuated, with May displaying a notable increase in sunshine hours compared to the past.
Climate Change Data Overview for St. Thomas, Virgin Islands (U.S.)
Explore the comprehensive climate change data for St. Thomas, Virgin Islands (U.S.). This detailed table provides valuable insights into temperature variations, precipitation levels, and seasonal changes influenced by climate change, helping you understand the unique weather patterns of this region.
Temperature °C
| Month | ⌀ 1940 - 1950 | ⌀ 2013 - 2023 | +/- |
|---|---|---|---|
| Jan | 24.51 | 25.29 | 0.78 |
| Feb | 24.43 | 24.99 | 0.56 |
| Mar | 24.49 | 25.00 | 0.51 |
| Apr | 24.86 | 25.48 | 0.62 |
| May | 25.65 | 26.28 | 0.63 |
| Jun | 26.47 | 27.04 | 0.58 |
| Jul | 26.74 | 27.33 | 0.59 |
| Aug | 26.96 | 27.64 | 0.67 |
| Sep | 26.79 | 27.80 | 1.00 |
| Oct | 26.53 | 27.52 | 0.99 |
| Nov | 25.93 | 26.83 | 0.90 |
| Dec | 25.39 | 26.07 | 0.67 |
| ⌀ Month | 25.73 | 26.44 | 0.71 |
Sunshine (h)
| Month | ⌀ 1940 - 1950 | ⌀ 2013 - 2023 | +/- |
|---|---|---|---|
| Jan | 10.39 | 10.35 | -0.04 |
| Feb | 10.77 | 10.75 | -0.02 |
| Mar | 11.02 | 10.91 | -0.11 |
| Apr | 11.46 | 11.29 | -0.17 |
| May | 11.23 | 11.39 | 0.16 |
| Jun | 11.65 | 11.76 | 0.11 |
| Jul | 11.75 | 11.40 | -0.35 |
| Aug | 11.22 | 10.94 | -0.28 |
| Sep | 10.30 | 10.49 | 0.20 |
| Oct | 9.93 | 9.96 | 0.03 |
| Nov | 9.70 | 9.50 | -0.20 |
| Dec | 10.00 | 10.10 | 0.10 |
| ⌀ Month | 10.78 | 10.74 | -0.05 |
Rain (mm)
| Month | ⌀ 1940 - 1950 | ⌀ 2013 - 2023 | +/- |
|---|---|---|---|
| Jan | 1.47 | 0.96 | -0.51 |
| Feb | 1.13 | 1.13 | -0.01 |
| Mar | 0.86 | 0.87 | 0.00 |
| Apr | 1.77 | 1.36 | -0.41 |
| May | 3.58 | 2.08 | -1.50 |
| Jun | 2.81 | 1.56 | -1.25 |
| Jul | 2.79 | 2.58 | -0.21 |
| Aug | 4.48 | 3.30 | -1.18 |
| Sep | 5.82 | 4.46 | -1.36 |
| Oct | 6.24 | 4.12 | -2.12 |
| Nov | 4.88 | 4.25 | -0.63 |
| Dec | 1.93 | 1.52 | -0.41 |
| ⌀ Month | 3.15 | 2.35 | -0.80 |
Snow (mm)
| Month | ⌀ 1940 - 1950 | ⌀ 2013 - 2023 | +/- |
|---|---|---|---|
| Jan | 0.00 | 0.00 | 0.00 |
| Feb | 0.00 | 0.00 | 0.00 |
| Mar | 0.00 | 0.00 | 0.00 |
| Apr | 0.00 | 0.00 | 0.00 |
| May | 0.00 | 0.00 | 0.00 |
| Jun | 0.00 | 0.00 | 0.00 |
| Jul | 0.00 | 0.00 | 0.00 |
| Aug | 0.00 | 0.00 | 0.00 |
| Sep | 0.00 | 0.00 | 0.00 |
| Oct | 0.00 | 0.00 | 0.00 |
| Nov | 0.00 | 0.00 | 0.00 |
| Dec | 0.00 | 0.00 | 0.00 |
| ⌀ Month | 0.00 | 0.00 | 0.00 |