Climate Chart of Sharjah, United Arab Emirates
Comprehensive Climate Chart of Sharjah, United Arab Emirates: Monthly Averages and Weather Trends
Discover the climate of Sharjah, United Arab Emirates.
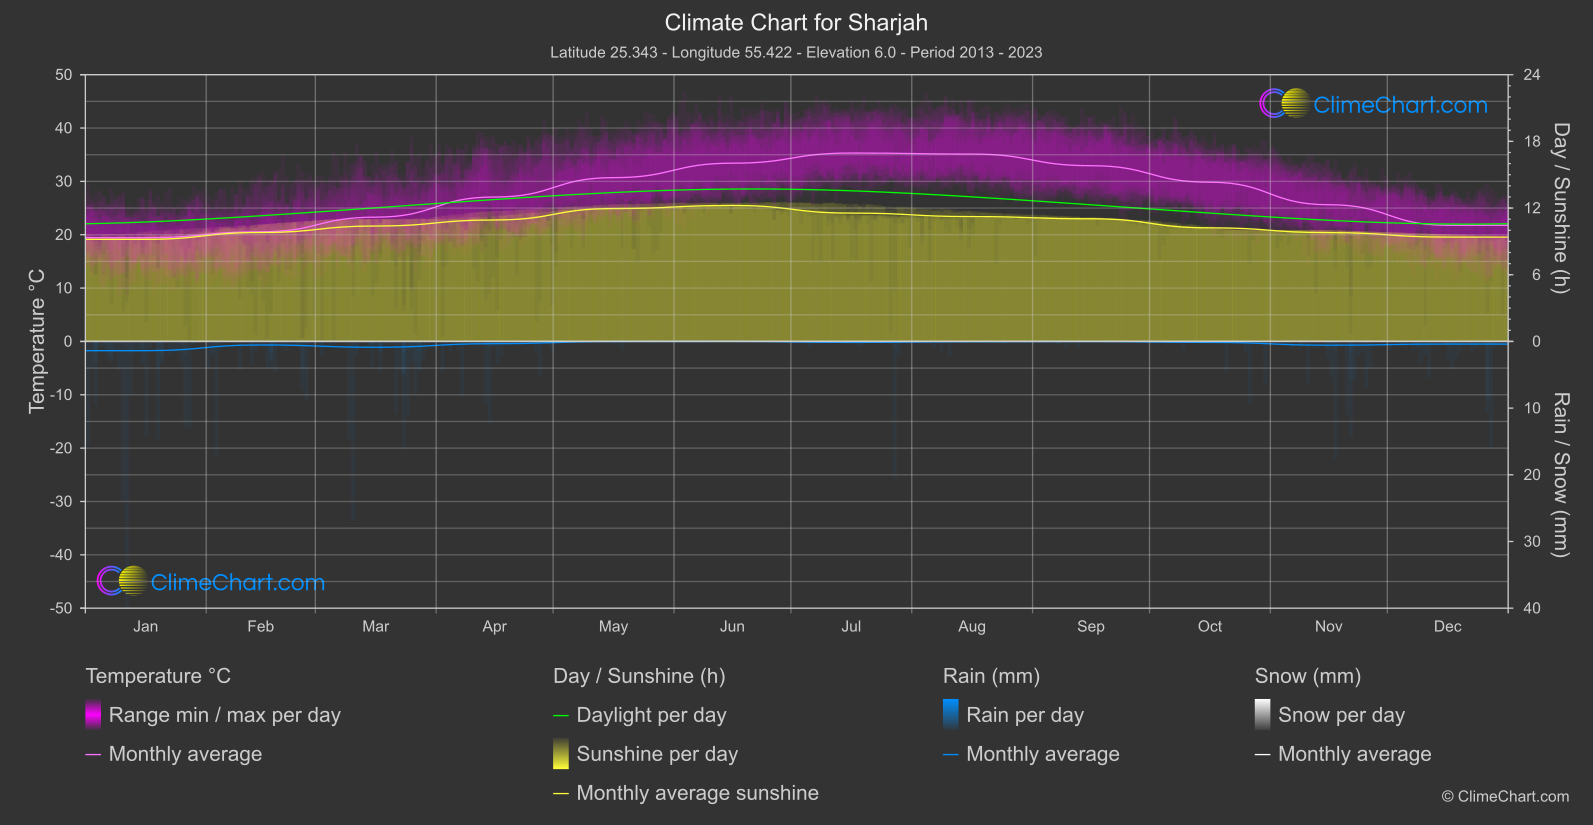
Sharjah, located in the United Arab Emirates, experiences a desert climate with hot summers and mild winters. The city receives minimal rainfall, primarily during the winter months. Sandstorms are common, especially in the summer. The average annual temperature in Sharjah is around 27°C (81°F).
Best Travel Time Guide for Sharjah, United Arab Emirates: Ideal Seasons and Weather Insights
The best time to travel to Sharjah is during the winter months, from November to March, when the weather is pleasant and ideal for outdoor activities. Avoid visiting in the summer due to extreme heat.
Climate Data Overview for Sharjah, United Arab Emirates
Explore the comprehensive climate data for Sharjah, United Arab Emirates. This detailed table provides valuable insights into temperature variations, precipitation levels, and seasonal changes, helping you understand the unique weather patterns of this region.
| Month | ⌀ Temperature °C | ⌀ Rain (mm) | ⌀ Snow (mm) | ⌀ Sunshine (h) |
|---|---|---|---|---|
| Jan | 19.4 | 0.69 | 0.00 | 9.19 |
| Feb | 20.6 | 0.26 | 0.00 | 9.80 |
| Mar | 23.3 | 0.44 | 0.00 | 10.38 |
| Apr | 27.1 | 0.17 | 0.00 | 10.93 |
| May | 30.7 | 0.01 | 0.00 | 11.95 |
| Jun | 33.4 | 0.00 | 0.00 | 12.23 |
| Jul | 35.3 | 0.07 | 0.00 | 11.55 |
| Aug | 35.1 | 0.02 | 0.00 | 11.23 |
| Sep | 32.9 | 0.01 | 0.00 | 11.03 |
| Oct | 29.8 | 0.07 | 0.00 | 10.22 |
| Nov | 25.6 | 0.28 | 0.00 | 9.79 |
| Dec | 21.8 | 0.20 | 0.00 | 9.39 |
| ⌀ Month | 27.9 | 0.19 | 0.00 | 10.64 |