Climate Change Chart of Sharjah, United Arab Emirates
Comprehensive Climate Change Chart of Sharjah, United Arab Emirates: Monthly Averages and Impact Trends
Exploring the climate change data in Sharjah, United Arab Emirates reveals interesting insights about temperature, rainfall, and sunshine duration over the years.
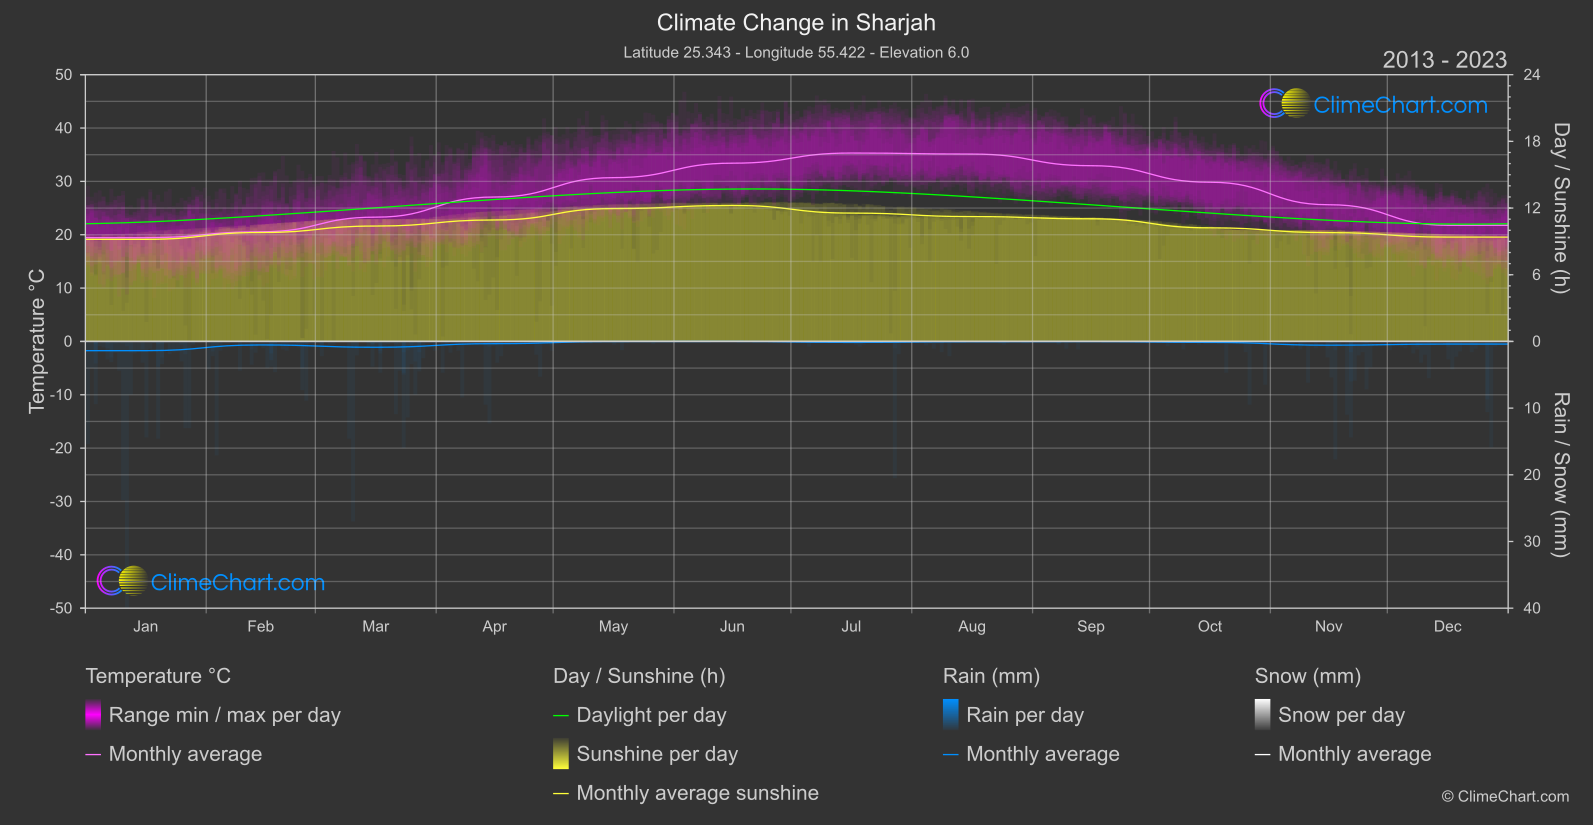
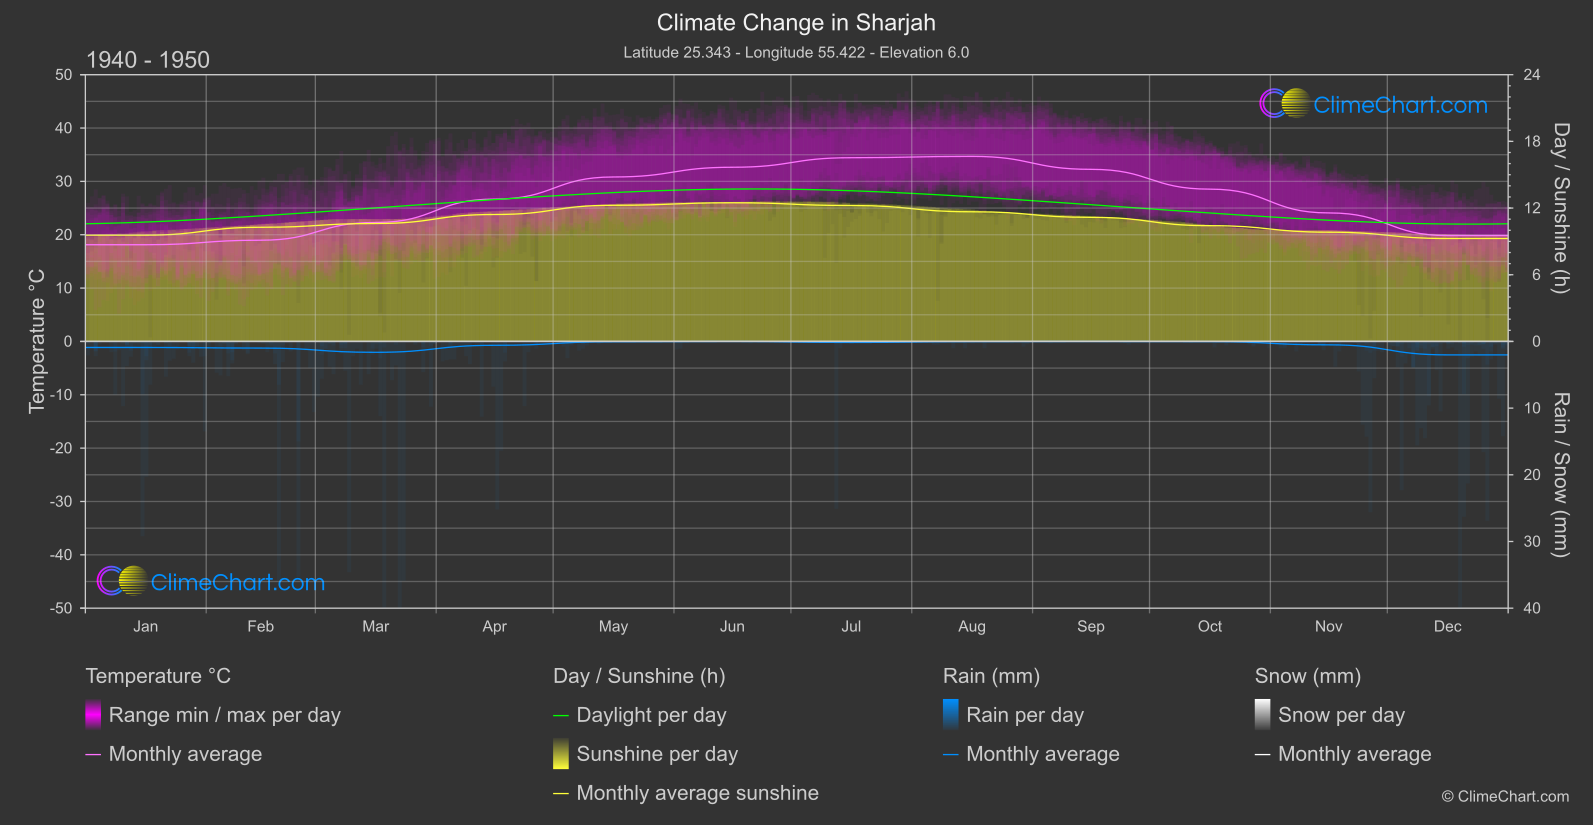
Sharjah, located in the United Arab Emirates, has experienced changes in climate parameters such as temperature, rainfall, and sunshine duration. The data from 1940-1950 compared to 2013-2024 shows varying trends across different months. For instance, the month with the highest temperature change is December, while the month with the highest rainfall change is March.
Climate Change Data Overview for Sharjah, United Arab Emirates
Explore the comprehensive climate change data for Sharjah, United Arab Emirates. This detailed table provides valuable insights into temperature variations, precipitation levels, and seasonal changes influenced by climate change, helping you understand the unique weather patterns of this region.
Temperature °C
| Month | ⌀ 1940 - 1950 | ⌀ 2013 - 2023 | +/- |
|---|---|---|---|
| Jan | 18.13 | 19.45 | 1.32 |
| Feb | 18.97 | 20.55 | 1.58 |
| Mar | 22.30 | 23.29 | 1.00 |
| Apr | 26.68 | 27.07 | 0.39 |
| May | 30.83 | 30.70 | -0.13 |
| Jun | 32.65 | 33.41 | 0.76 |
| Jul | 34.44 | 35.31 | 0.88 |
| Aug | 34.69 | 35.12 | 0.43 |
| Sep | 32.26 | 32.94 | 0.68 |
| Oct | 28.54 | 29.84 | 1.30 |
| Nov | 24.09 | 25.62 | 1.53 |
| Dec | 19.84 | 21.77 | 1.94 |
| ⌀ Month | 26.95 | 27.92 | 0.97 |
Sunshine (h)
| Month | ⌀ 1940 - 1950 | ⌀ 2013 - 2023 | +/- |
|---|---|---|---|
| Jan | 9.56 | 9.19 | -0.38 |
| Feb | 10.27 | 9.80 | -0.47 |
| Mar | 10.61 | 10.38 | -0.23 |
| Apr | 11.42 | 10.93 | -0.49 |
| May | 12.25 | 11.95 | -0.30 |
| Jun | 12.48 | 12.23 | -0.24 |
| Jul | 12.23 | 11.55 | -0.68 |
| Aug | 11.67 | 11.23 | -0.43 |
| Sep | 11.16 | 11.03 | -0.13 |
| Oct | 10.42 | 10.22 | -0.19 |
| Nov | 9.83 | 9.79 | -0.04 |
| Dec | 9.26 | 9.39 | 0.13 |
| ⌀ Month | 10.93 | 10.64 | -0.29 |
Rain (mm)
| Month | ⌀ 1940 - 1950 | ⌀ 2013 - 2023 | +/- |
|---|---|---|---|
| Jan | 0.45 | 0.69 | 0.24 |
| Feb | 0.50 | 0.26 | -0.23 |
| Mar | 0.82 | 0.44 | -0.38 |
| Apr | 0.29 | 0.17 | -0.12 |
| May | 0.03 | 0.01 | -0.02 |
| Jun | 0.00 | 0.00 | -0.00 |
| Jul | 0.08 | 0.07 | -0.00 |
| Aug | 0.01 | 0.02 | 0.01 |
| Sep | 0.00 | 0.01 | 0.00 |
| Oct | 0.01 | 0.07 | 0.06 |
| Nov | 0.26 | 0.28 | 0.03 |
| Dec | 1.01 | 0.20 | -0.81 |
| ⌀ Month | 0.29 | 0.19 | -0.10 |
Snow (mm)
| Month | ⌀ 1940 - 1950 | ⌀ 2013 - 2023 | +/- |
|---|---|---|---|
| Jan | 0.00 | 0.00 | 0.00 |
| Feb | 0.00 | 0.00 | 0.00 |
| Mar | 0.00 | 0.00 | 0.00 |
| Apr | 0.00 | 0.00 | 0.00 |
| May | 0.00 | 0.00 | 0.00 |
| Jun | 0.00 | 0.00 | 0.00 |
| Jul | 0.00 | 0.00 | 0.00 |
| Aug | 0.00 | 0.00 | 0.00 |
| Sep | 0.00 | 0.00 | 0.00 |
| Oct | 0.00 | 0.00 | 0.00 |
| Nov | 0.00 | 0.00 | 0.00 |
| Dec | 0.00 | 0.00 | 0.00 |
| ⌀ Month | 0.00 | 0.00 | 0.00 |