Climate Chart of Richmond, USA
Comprehensive Climate Chart of Richmond, USA: Monthly Averages and Weather Trends
Richmond, USA: Climate Overview
Richmond, located in the state of Virginia, experiences a humid subtropical climate with hot, humid summers and mild winters. The city receives ample rainfall throughout the year, with the wettest months typically being May and June. Summers are characterized by high temperatures often reaching the mid-80s to low 90s Fahrenheit, while winters are relatively mild with temperatures rarely dropping below freezing. Snowfall is minimal in Richmond, and the city experiences a moderate level of humidity.
Best Travel Time Guide for Richmond, USA: Ideal Seasons and Weather Insights
Best Time to Travel to Richmond
Climate Data Overview for Richmond, USA
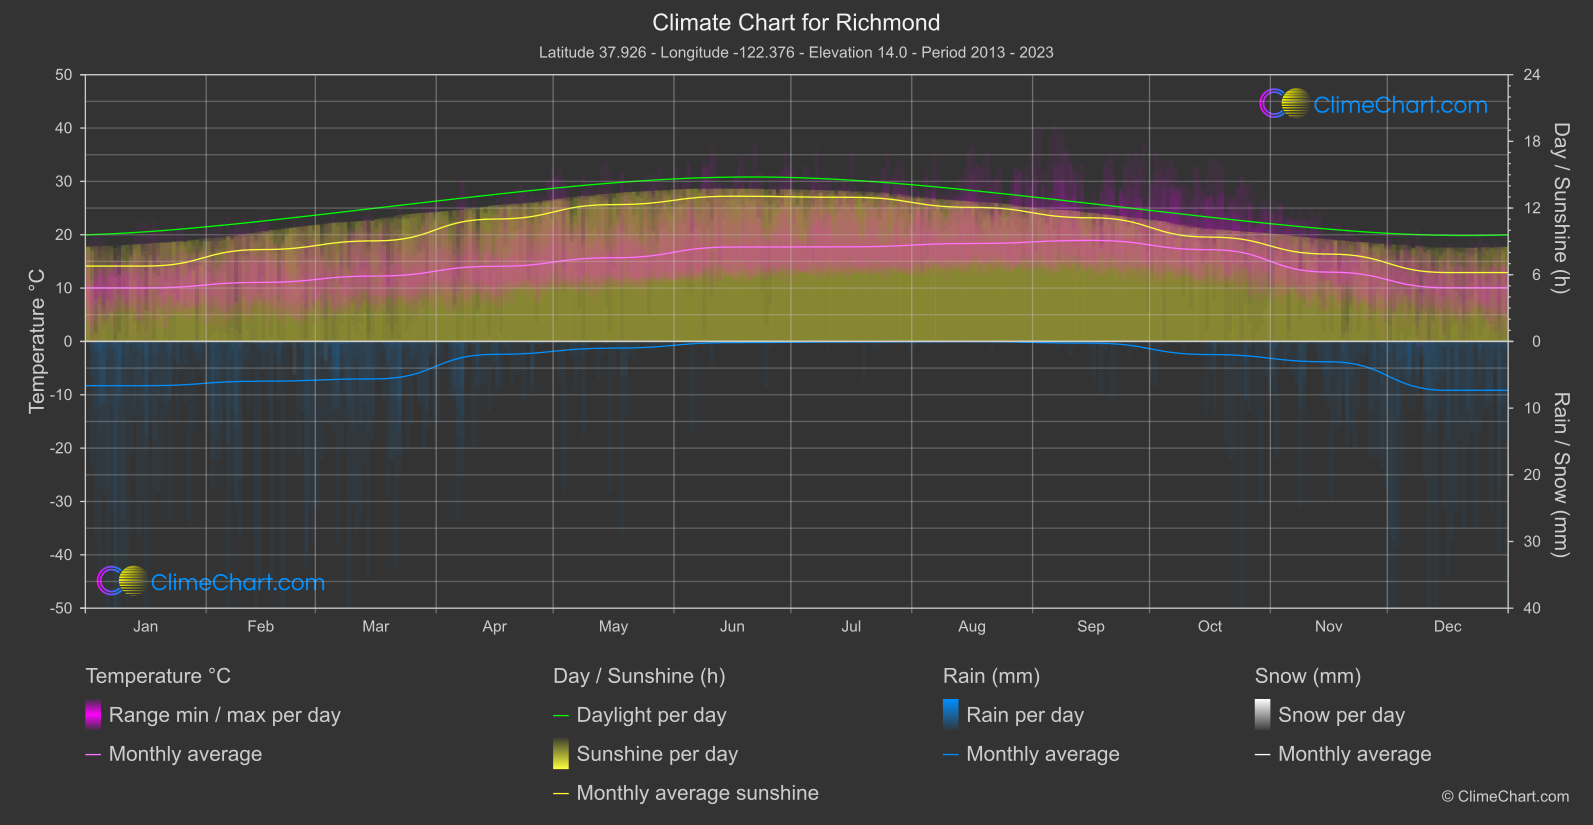
Explore the comprehensive climate data for Richmond, USA. This detailed table provides valuable insights into temperature variations, precipitation levels, and seasonal changes, helping you understand the unique weather patterns of this region.
| Month | ⌀ Temperature °C | ⌀ Rain (mm) | ⌀ Snow (mm) | ⌀ Sunshine (h) |
|---|---|---|---|---|
| Jan | 10.0 | 3.32 | 0.00 | 6.78 |
| Feb | 11.1 | 2.98 | 0.00 | 8.26 |
| Mar | 12.3 | 2.81 | 0.00 | 9.05 |
| Apr | 14.1 | 0.97 | 0.00 | 11.01 |
| May | 15.7 | 0.50 | 0.00 | 12.31 |
| Jun | 17.7 | 0.09 | 0.00 | 13.07 |
| Jul | 17.7 | 0.04 | 0.00 | 12.96 |
| Aug | 18.4 | 0.01 | 0.00 | 12.06 |
| Sep | 18.9 | 0.13 | 0.00 | 11.12 |
| Oct | 17.2 | 0.99 | 0.00 | 9.39 |
| Nov | 13.0 | 1.53 | 0.00 | 7.86 |
| Dec | 10.1 | 3.67 | 0.00 | 6.20 |
| ⌀ Month | 14.7 | 1.42 | 0.00 | 10.01 |