Climate Change Chart of Richmond, USA
Comprehensive Climate Change Chart of Richmond, USA: Monthly Averages and Impact Trends
Exploring the changing climate in Richmond, USA reveals intriguing insights into temperature, rainfall, and sunshine duration over the years.
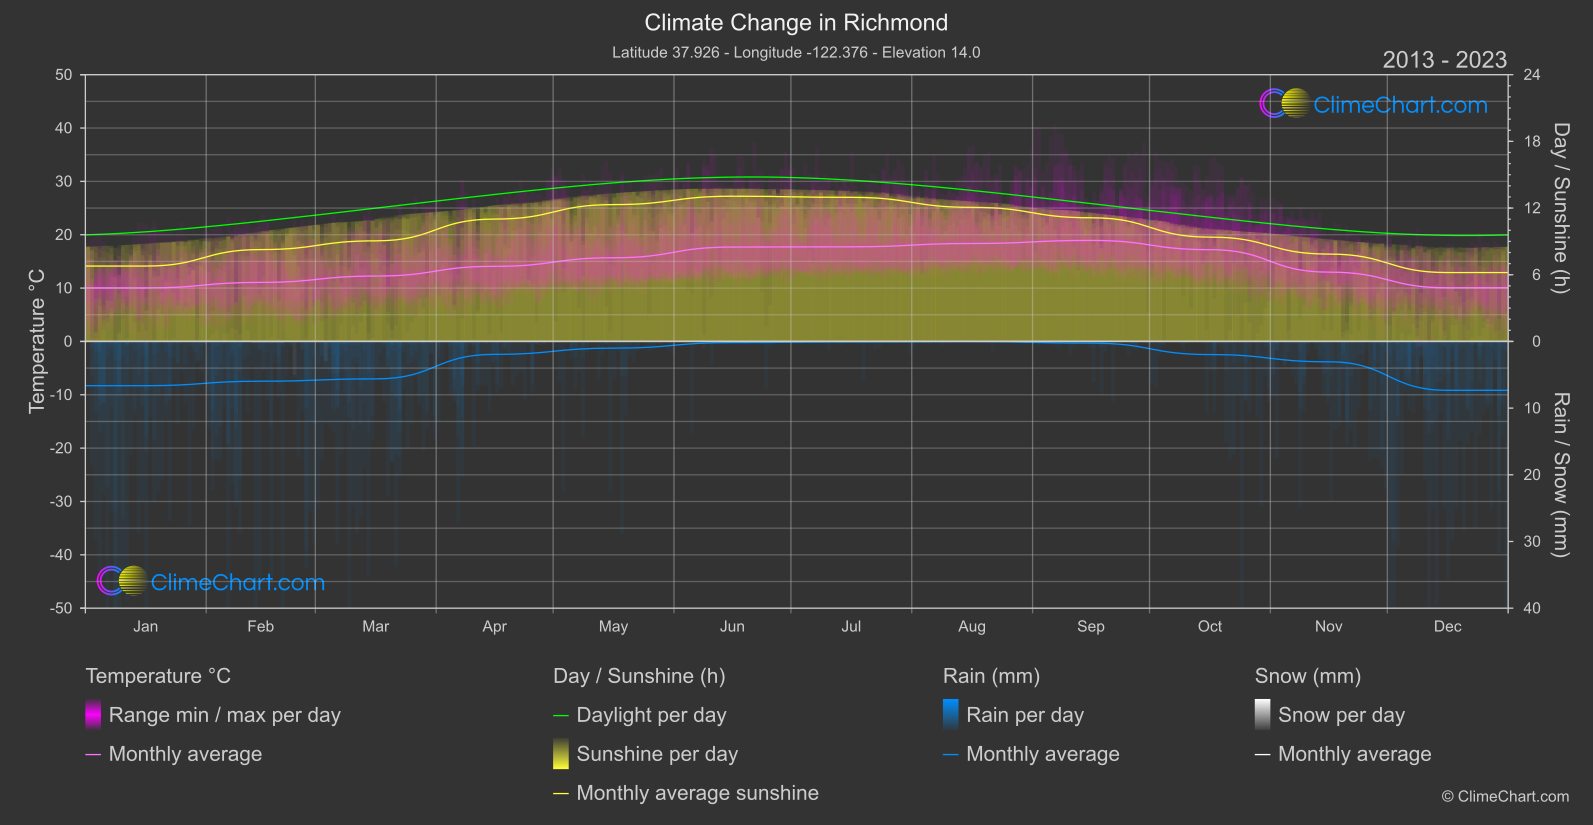
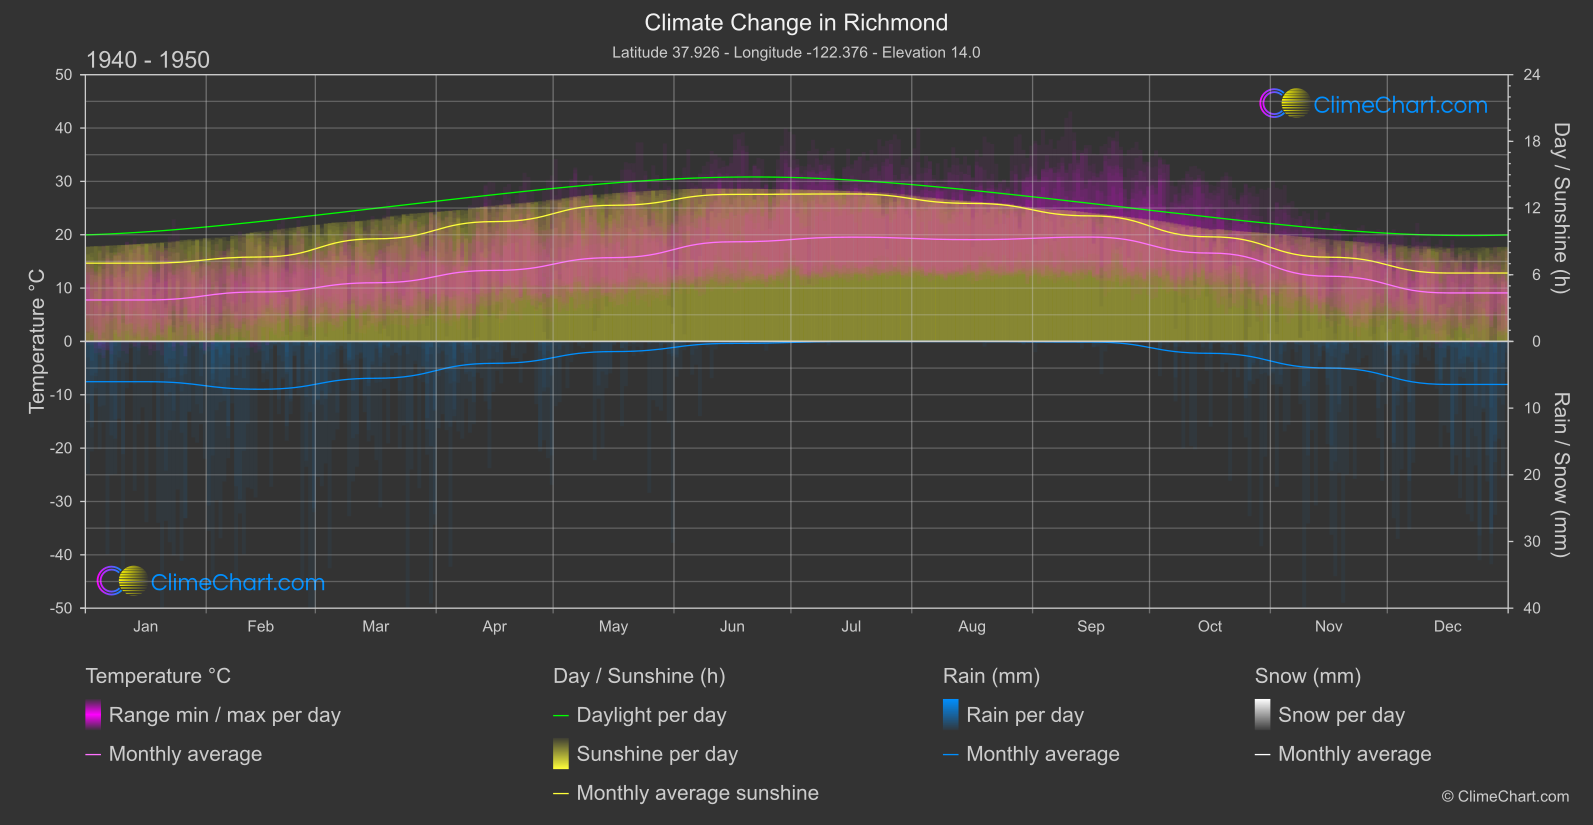
Richmond, USA experiences varying climate patterns, with notable changes in temperature, rainfall, and sunshine duration. Analyzing the data from 1940-1950 compared to 2013-2024, it is evident that certain months exhibit significant shifts. For instance, January shows a temperature increase of 2.25°C, while May experiences a slight decrease in temperature. Regarding rainfall, there is a noticeable decrease in April compared to the past. Sunshine duration also displays fluctuations throughout the year, with varying trends in different months.
Climate Change Data Overview for Richmond, USA
Explore the comprehensive climate change data for Richmond, USA. This detailed table provides valuable insights into temperature variations, precipitation levels, and seasonal changes influenced by climate change, helping you understand the unique weather patterns of this region.
Temperature °C
| Month | ⌀ 1940 - 1950 | ⌀ 2013 - 2023 | +/- |
|---|---|---|---|
| Jan | 7.78 | 10.03 | 2.25 |
| Feb | 9.28 | 11.07 | 1.79 |
| Mar | 11.00 | 12.25 | 1.26 |
| Apr | 13.32 | 14.08 | 0.76 |
| May | 15.71 | 15.68 | -0.02 |
| Jun | 18.67 | 17.69 | -0.98 |
| Jul | 19.54 | 17.74 | -1.80 |
| Aug | 19.08 | 18.36 | -0.72 |
| Sep | 19.56 | 18.93 | -0.62 |
| Oct | 16.56 | 17.20 | 0.64 |
| Nov | 12.22 | 12.99 | 0.77 |
| Dec | 9.09 | 10.05 | 0.96 |
| ⌀ Month | 14.32 | 14.67 | 0.36 |
Sunshine (h)
| Month | ⌀ 1940 - 1950 | ⌀ 2013 - 2023 | +/- |
|---|---|---|---|
| Jan | 7.04 | 6.78 | -0.26 |
| Feb | 7.60 | 8.26 | 0.67 |
| Mar | 9.23 | 9.05 | -0.18 |
| Apr | 10.78 | 11.01 | 0.23 |
| May | 12.25 | 12.31 | 0.06 |
| Jun | 13.23 | 13.07 | -0.17 |
| Jul | 13.27 | 12.96 | -0.30 |
| Aug | 12.42 | 12.06 | -0.36 |
| Sep | 11.30 | 11.12 | -0.17 |
| Oct | 9.41 | 9.39 | -0.03 |
| Nov | 7.58 | 7.86 | 0.28 |
| Dec | 6.15 | 6.20 | 0.04 |
| ⌀ Month | 10.02 | 10.01 | -0.02 |
Rain (mm)
| Month | ⌀ 1940 - 1950 | ⌀ 2013 - 2023 | +/- |
|---|---|---|---|
| Jan | 3.02 | 3.32 | 0.30 |
| Feb | 3.59 | 2.98 | -0.60 |
| Mar | 2.76 | 2.81 | 0.05 |
| Apr | 1.64 | 0.97 | -0.67 |
| May | 0.76 | 0.50 | -0.26 |
| Jun | 0.15 | 0.09 | -0.06 |
| Jul | 0.00 | 0.04 | 0.03 |
| Aug | 0.00 | 0.01 | 0.01 |
| Sep | 0.04 | 0.13 | 0.08 |
| Oct | 0.89 | 0.99 | 0.09 |
| Nov | 1.99 | 1.53 | -0.47 |
| Dec | 3.22 | 3.67 | 0.44 |
| ⌀ Month | 1.51 | 1.42 | -0.09 |
Snow (mm)
| Month | ⌀ 1940 - 1950 | ⌀ 2013 - 2023 | +/- |
|---|---|---|---|
| Jan | 0.00 | 0.00 | 0.00 |
| Feb | 0.00 | 0.00 | 0.00 |
| Mar | 0.00 | 0.00 | 0.00 |
| Apr | 0.00 | 0.00 | 0.00 |
| May | 0.00 | 0.00 | 0.00 |
| Jun | 0.00 | 0.00 | 0.00 |
| Jul | 0.00 | 0.00 | 0.00 |
| Aug | 0.00 | 0.00 | 0.00 |
| Sep | 0.00 | 0.00 | 0.00 |
| Oct | 0.00 | 0.00 | 0.00 |
| Nov | 0.00 | 0.00 | 0.00 |
| Dec | 0.00 | 0.00 | 0.00 |
| ⌀ Month | 0.00 | 0.00 | 0.00 |