Climate Chart of Puerto Vallarta, Mexico
Comprehensive Climate Chart of Puerto Vallarta, Mexico: Monthly Averages and Weather Trends
Welcome to Puerto Vallarta, Mexico!
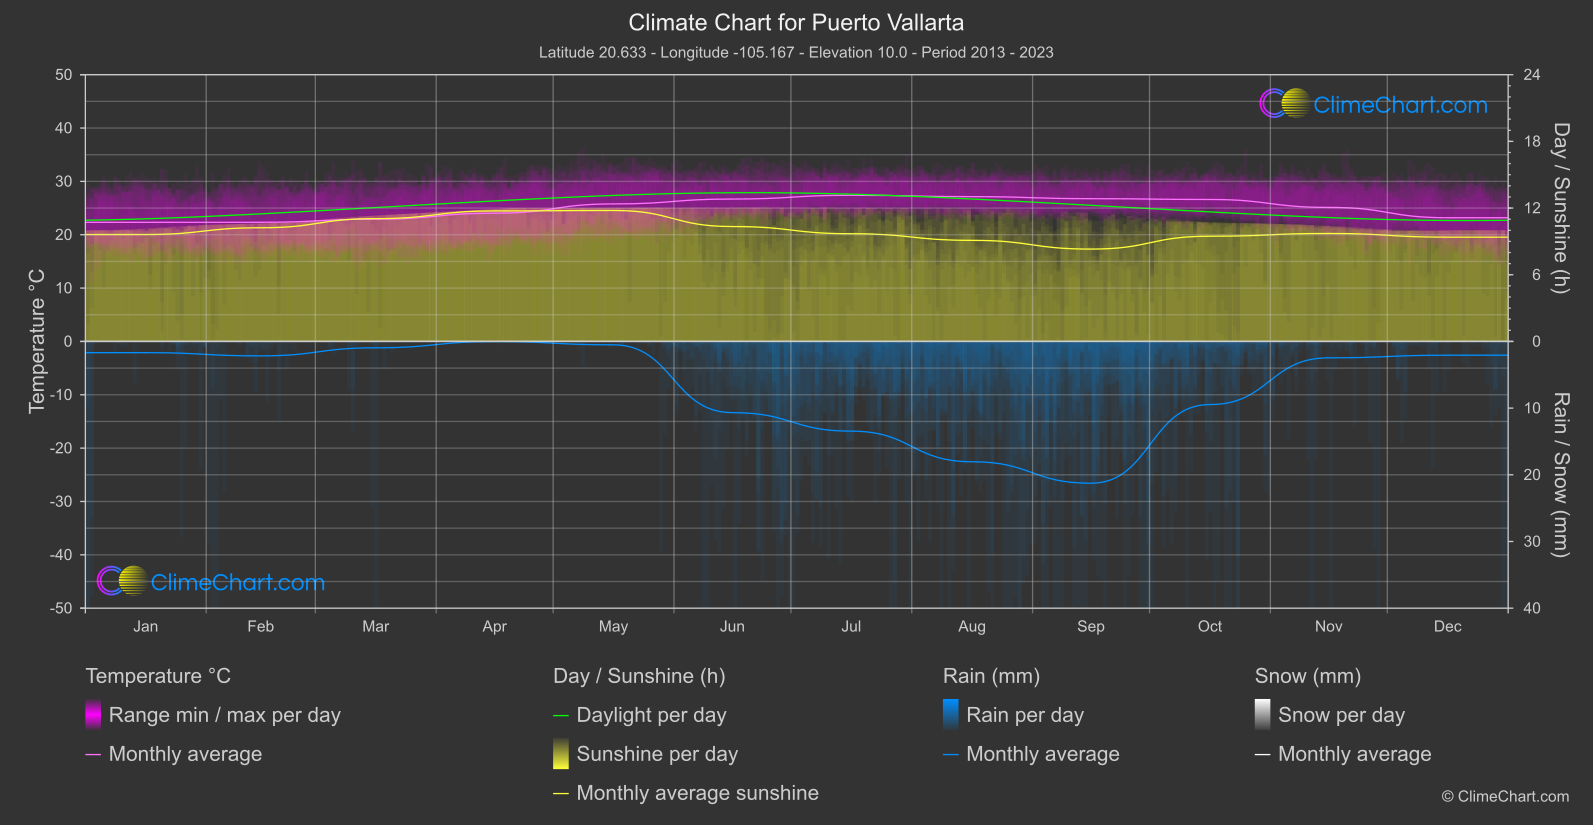
Puerto Vallarta, located on the Pacific coast of Mexico, enjoys a tropical climate with warm temperatures throughout the year. The average annual temperature is around 27°C (80°F) with high humidity. The rainy season usually lasts from June to October, with September being the wettest month. Winter months from November to April are drier and more comfortable for visitors.
Best Travel Time Guide for Puerto Vallarta, Mexico: Ideal Seasons and Weather Insights
The best time to travel to Puerto Vallarta is during the dry season from November to April when the weather is pleasant and ideal for beach activities and sightseeing. However, if you prefer fewer crowds and lower hotel rates, you may consider visiting during the shoulder seasons of May to June or September to October.
Climate Data Overview for Puerto Vallarta, Mexico
Explore the comprehensive climate data for Puerto Vallarta, Mexico. This detailed table provides valuable insights into temperature variations, precipitation levels, and seasonal changes, helping you understand the unique weather patterns of this region.
| Month | ⌀ Temperature °C | ⌀ Rain (mm) | ⌀ Snow (mm) | ⌀ Sunshine (h) |
|---|---|---|---|---|
| Jan | 22.3 | 0.84 | 0.00 | 9.62 |
| Feb | 22.3 | 1.08 | 0.00 | 10.23 |
| Mar | 22.9 | 0.48 | 0.00 | 11.05 |
| Apr | 24.0 | 0.01 | 0.00 | 11.74 |
| May | 25.8 | 0.25 | 0.00 | 11.78 |
| Jun | 26.7 | 5.34 | 0.00 | 10.34 |
| Jul | 27.4 | 6.73 | 0.00 | 9.69 |
| Aug | 27.1 | 9.02 | 0.00 | 9.09 |
| Sep | 26.8 | 10.63 | 0.00 | 8.31 |
| Oct | 26.6 | 4.73 | 0.00 | 9.47 |
| Nov | 25.1 | 1.23 | 0.00 | 9.71 |
| Dec | 23.2 | 1.03 | 0.00 | 9.38 |
| ⌀ Month | 25.0 | 3.45 | 0.00 | 10.03 |