Climate Change Chart of Puerto Vallarta, Mexico
Comprehensive Climate Change Chart of Puerto Vallarta, Mexico: Monthly Averages and Impact Trends
Exploring the changing climate in Puerto Vallarta, Mexico reveals intriguing insights into temperature, rainfall, and sunshine duration trends. Discover how climate patterns have evolved over the years.
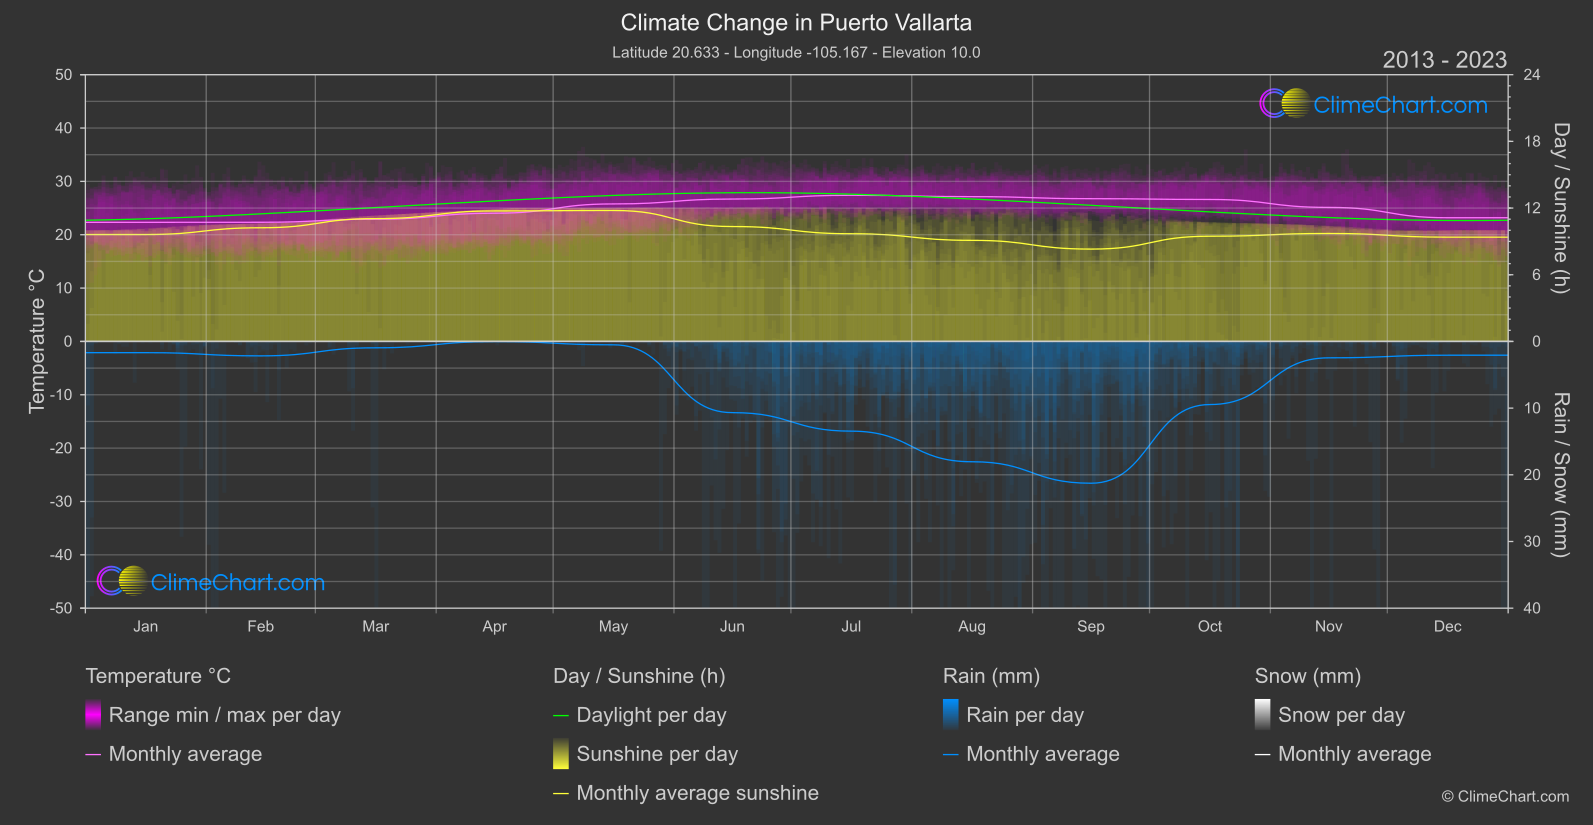
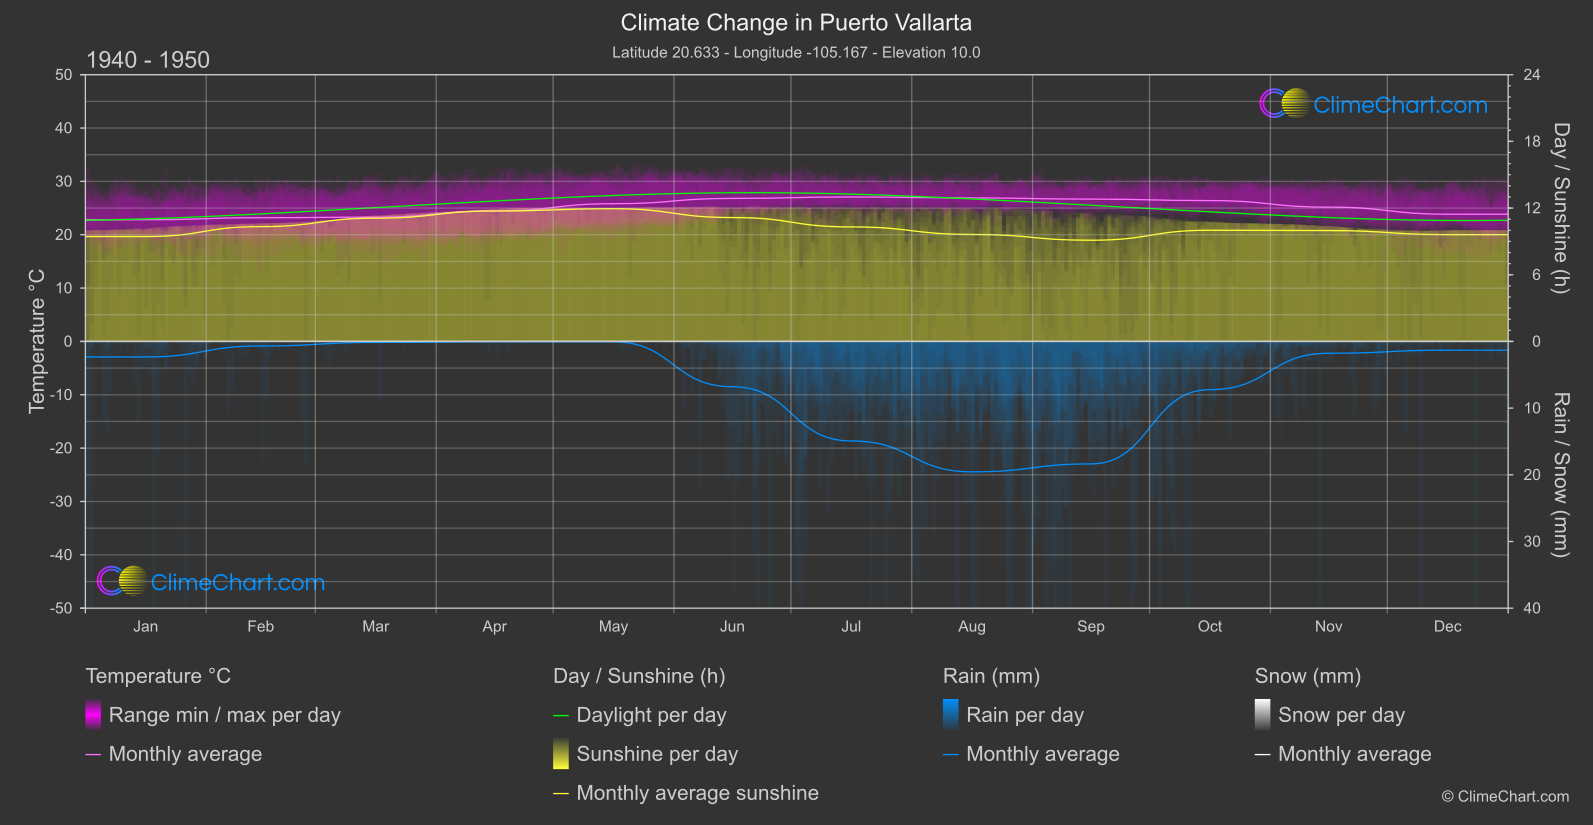
Puerto Vallarta, Mexico experiences varying climate conditions, with noticeable changes in temperature, rainfall, and sunshine duration over the years. Analyzing the data from the 1940s to the 1950s compared to 2013 to 2024 reveals interesting patterns. For instance, the month of July shows a significant increase in temperature, while September experiences a notable rise in rainfall. The sunshine duration also fluctuates, with June having a considerable decrease in hours of sunlight. These shifts in climate metrics highlight the dynamic nature of Puerto Vallarta's weather patterns.
Climate Change Data Overview for Puerto Vallarta, Mexico
Explore the comprehensive climate change data for Puerto Vallarta, Mexico. This detailed table provides valuable insights into temperature variations, precipitation levels, and seasonal changes influenced by climate change, helping you understand the unique weather patterns of this region.
Temperature °C
| Month | ⌀ 1940 - 1950 | ⌀ 2013 - 2023 | +/- |
|---|---|---|---|
| Jan | 22.81 | 22.32 | -0.49 |
| Feb | 23.19 | 22.34 | -0.86 |
| Mar | 23.29 | 22.90 | -0.39 |
| Apr | 24.46 | 24.03 | -0.42 |
| May | 25.81 | 25.77 | -0.04 |
| Jun | 26.81 | 26.69 | -0.12 |
| Jul | 27.08 | 27.40 | 0.32 |
| Aug | 26.90 | 27.14 | 0.24 |
| Sep | 26.68 | 26.76 | 0.08 |
| Oct | 26.40 | 26.61 | 0.21 |
| Nov | 25.17 | 25.12 | -0.05 |
| Dec | 23.85 | 23.19 | -0.66 |
| ⌀ Month | 25.20 | 25.02 | -0.18 |
Sunshine (h)
| Month | ⌀ 1940 - 1950 | ⌀ 2013 - 2023 | +/- |
|---|---|---|---|
| Jan | 9.44 | 9.62 | 0.18 |
| Feb | 10.33 | 10.23 | -0.10 |
| Mar | 11.09 | 11.05 | -0.04 |
| Apr | 11.74 | 11.74 | 0.00 |
| May | 11.94 | 11.78 | -0.16 |
| Jun | 11.15 | 10.34 | -0.81 |
| Jul | 10.30 | 9.69 | -0.61 |
| Aug | 9.63 | 9.09 | -0.53 |
| Sep | 9.10 | 8.31 | -0.80 |
| Oct | 10.00 | 9.47 | -0.54 |
| Nov | 9.97 | 9.71 | -0.26 |
| Dec | 9.61 | 9.38 | -0.23 |
| ⌀ Month | 10.36 | 10.03 | -0.32 |
Rain (mm)
| Month | ⌀ 1940 - 1950 | ⌀ 2013 - 2023 | +/- |
|---|---|---|---|
| Jan | 1.16 | 0.84 | -0.32 |
| Feb | 0.34 | 1.08 | 0.74 |
| Mar | 0.07 | 0.48 | 0.41 |
| Apr | 0.03 | 0.01 | -0.02 |
| May | 0.03 | 0.25 | 0.22 |
| Jun | 3.40 | 5.34 | 1.94 |
| Jul | 7.46 | 6.73 | -0.74 |
| Aug | 9.78 | 9.02 | -0.76 |
| Sep | 9.18 | 10.63 | 1.45 |
| Oct | 3.61 | 4.73 | 1.12 |
| Nov | 0.89 | 1.23 | 0.34 |
| Dec | 0.66 | 1.03 | 0.38 |
| ⌀ Month | 3.05 | 3.45 | 0.40 |
Snow (mm)
| Month | ⌀ 1940 - 1950 | ⌀ 2013 - 2023 | +/- |
|---|---|---|---|
| Jan | 0.00 | 0.00 | 0.00 |
| Feb | 0.00 | 0.00 | 0.00 |
| Mar | 0.00 | 0.00 | 0.00 |
| Apr | 0.00 | 0.00 | 0.00 |
| May | 0.00 | 0.00 | 0.00 |
| Jun | 0.00 | 0.00 | 0.00 |
| Jul | 0.00 | 0.00 | 0.00 |
| Aug | 0.00 | 0.00 | 0.00 |
| Sep | 0.00 | 0.00 | 0.00 |
| Oct | 0.00 | 0.00 | 0.00 |
| Nov | 0.00 | 0.00 | 0.00 |
| Dec | 0.00 | 0.00 | 0.00 |
| ⌀ Month | 0.00 | 0.00 | 0.00 |