Climate Chart of Phuket, Thailand
Comprehensive Climate Chart of Phuket, Thailand: Monthly Averages and Weather Trends
Discover the Climate of Phuket, Thailand
Phuket, Thailand, enjoys a tropical monsoon climate with warm weather throughout the year. The island experiences two main seasons: the dry season from November to April and the wet season from May to October. The average temperature in Phuket ranges from 25°C to 32°C, making it an ideal destination for beach lovers and water sports enthusiasts.
Best Travel Time Guide for Phuket, Thailand: Ideal Seasons and Weather Insights
The best time to visit Phuket is during the dry season from November to April when the weather is sunny and pleasant. This period is perfect for beach activities, sightseeing, and water sports. However, if you prefer fewer crowds and lower prices, consider visiting during the shoulder seasons of May to October despite occasional rainfall.
Climate Data Overview for Phuket, Thailand
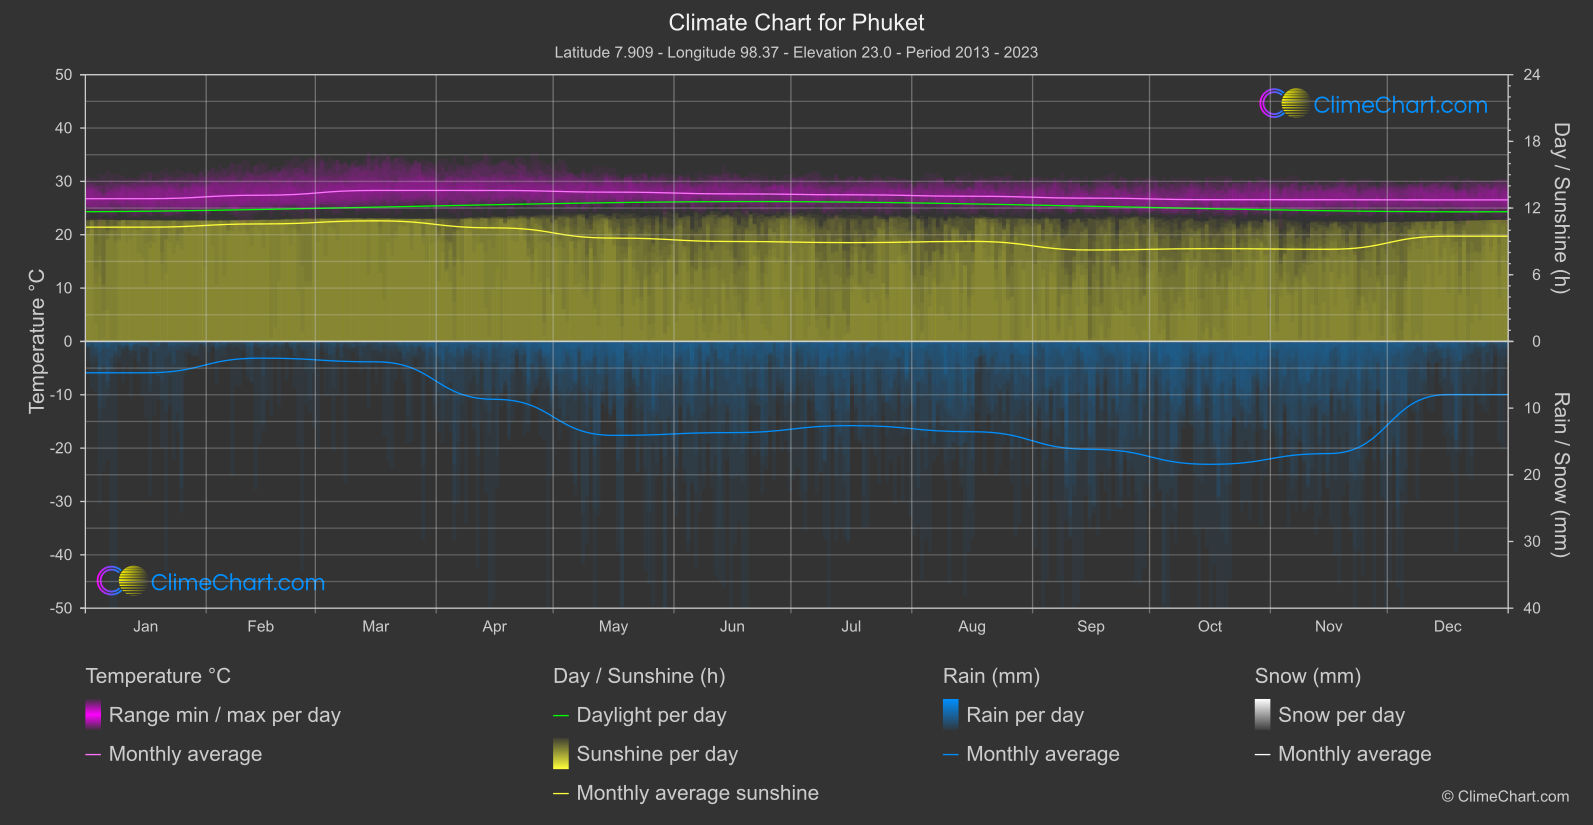
Explore the comprehensive climate data for Phuket, Thailand. This detailed table provides valuable insights into temperature variations, precipitation levels, and seasonal changes, helping you understand the unique weather patterns of this region.
| Month | ⌀ Temperature °C | ⌀ Rain (mm) | ⌀ Snow (mm) | ⌀ Sunshine (h) |
|---|---|---|---|---|
| Jan | 26.8 | 2.35 | 0.00 | 10.28 |
| Feb | 27.4 | 1.25 | 0.00 | 10.57 |
| Mar | 28.3 | 1.53 | 0.00 | 10.85 |
| Apr | 28.3 | 4.34 | 0.00 | 10.22 |
| May | 28.0 | 7.04 | 0.00 | 9.30 |
| Jun | 27.7 | 6.83 | 0.00 | 8.99 |
| Jul | 27.5 | 6.31 | 0.00 | 8.89 |
| Aug | 27.2 | 6.77 | 0.00 | 9.00 |
| Sep | 26.9 | 8.09 | 0.00 | 8.23 |
| Oct | 26.6 | 9.21 | 0.00 | 8.35 |
| Nov | 26.6 | 8.41 | 0.00 | 8.29 |
| Dec | 26.5 | 3.99 | 0.00 | 9.47 |
| ⌀ Month | 27.3 | 5.51 | 0.00 | 9.37 |