Climate Change Chart of Phuket, Thailand
Comprehensive Climate Change Chart of Phuket, Thailand: Monthly Averages and Impact Trends
Explore the climate change data in Phuket, Thailand, showcasing the impact on temperature, rainfall, and sunshine duration over the years.
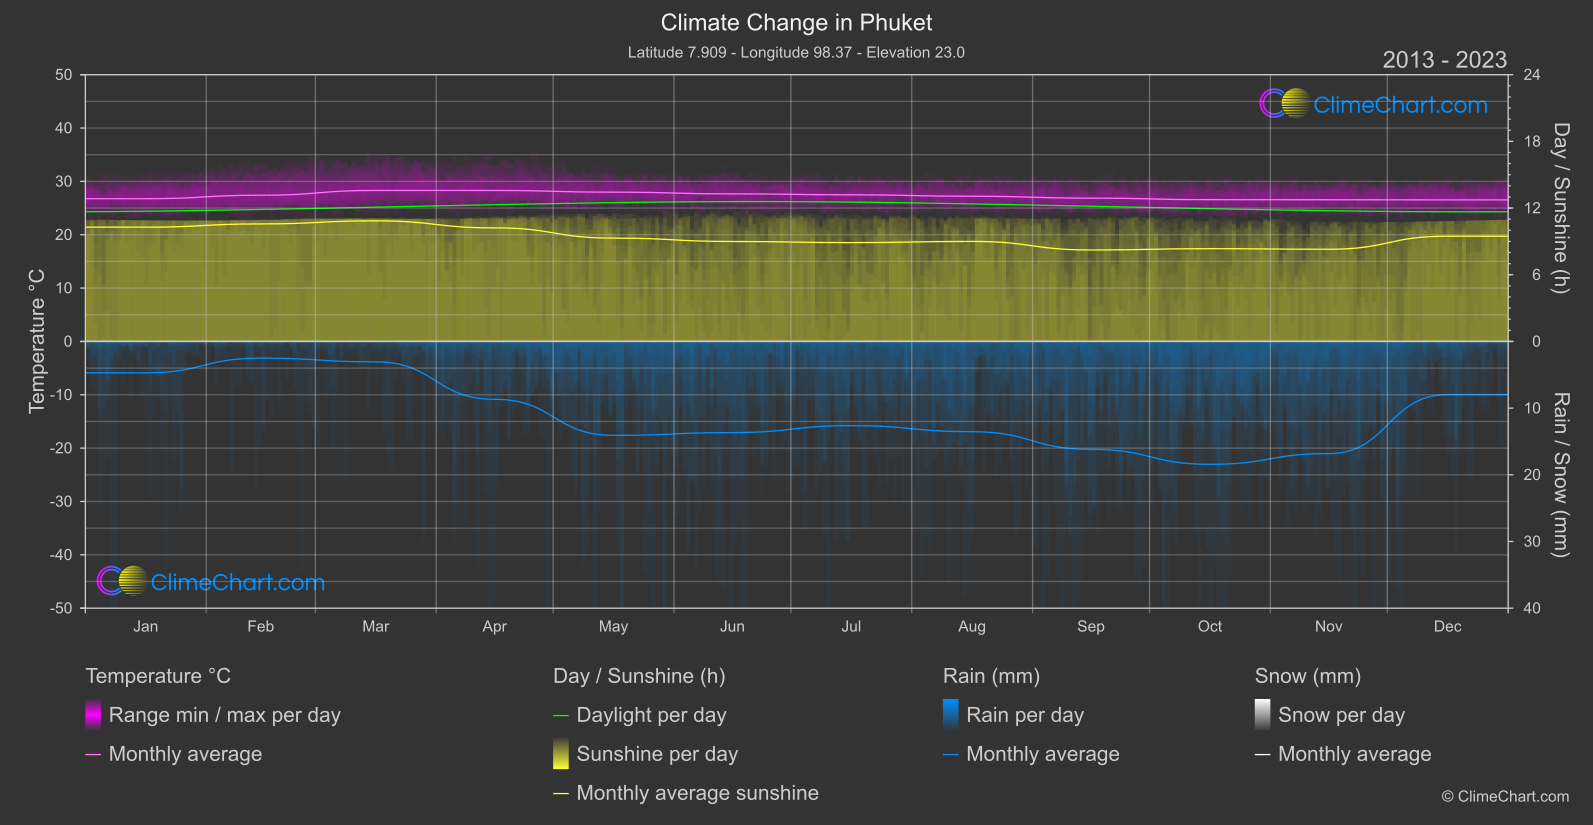
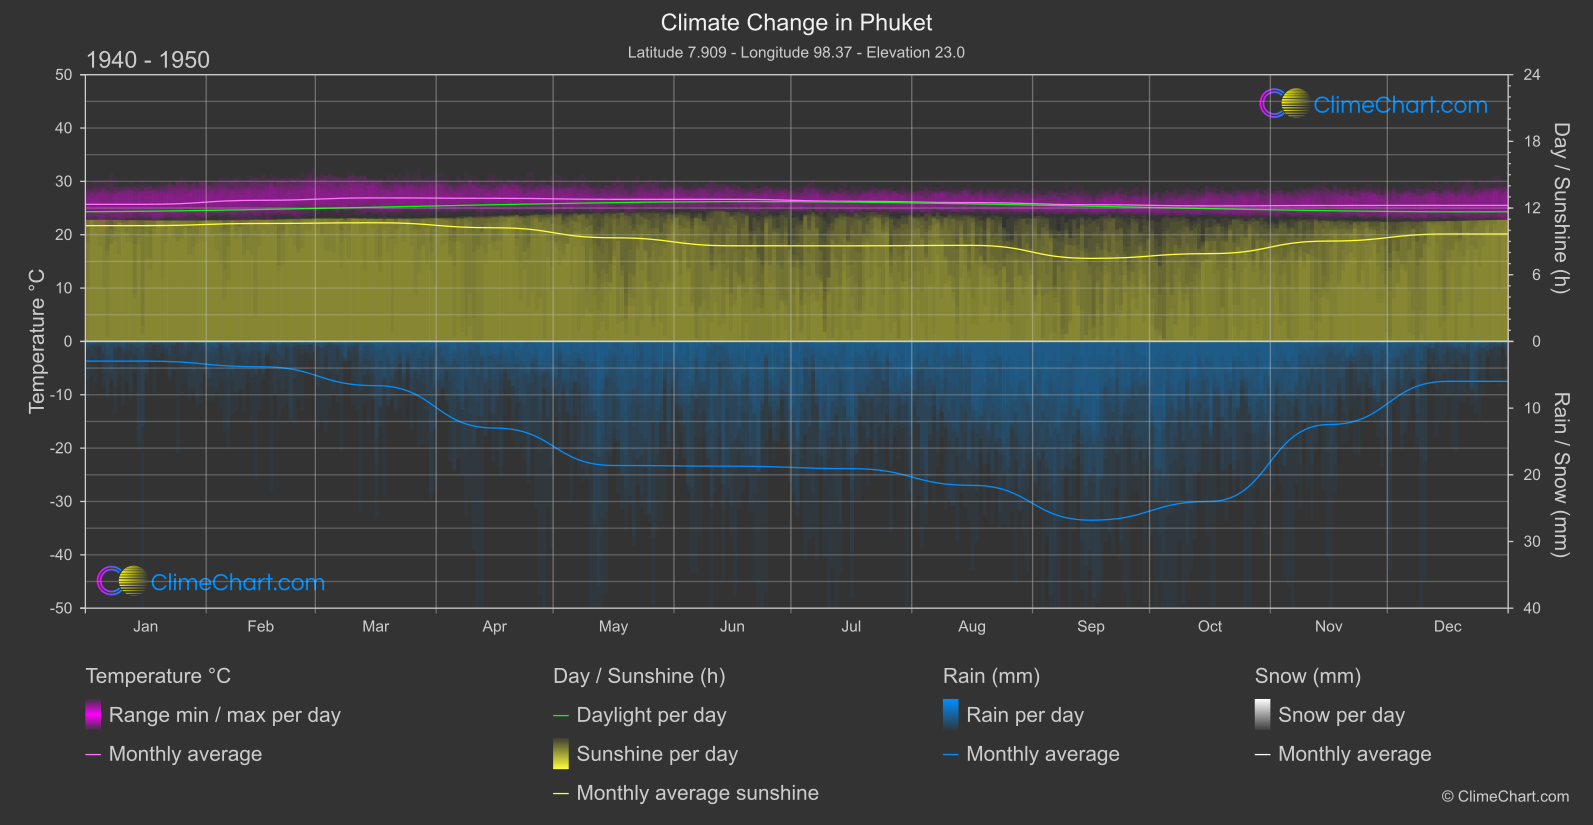
Phuket, Thailand has experienced significant changes in its climate patterns over the years. Analyzing the temperature data from 1940 to 1950 compared to 2013 to 2024 reveals a noticeable increase in temperatures across most months, with March showing the highest temperature change of 1.40°C. On the other hand, the rainfall data indicates varying trends, with some months experiencing a decrease in rainfall like August, which saw a substantial drop of 4.02 mm. Additionally, the sunshine duration data highlights fluctuations in sunlight exposure, with September showing the highest increase in sunshine duration of 0.76 hours. These insights underscore the evolving climate conditions in Phuket and the need for sustainable approaches to address climate change.
Climate Change Data Overview for Phuket, Thailand
Explore the comprehensive climate change data for Phuket, Thailand. This detailed table provides valuable insights into temperature variations, precipitation levels, and seasonal changes influenced by climate change, helping you understand the unique weather patterns of this region.
Temperature °C
| Month | ⌀ 1940 - 1950 | ⌀ 2013 - 2023 | +/- |
|---|---|---|---|
| Jan | 25.70 | 26.75 | 1.05 |
| Feb | 26.46 | 27.40 | 0.95 |
| Mar | 26.91 | 28.31 | 1.40 |
| Apr | 26.83 | 28.30 | 1.47 |
| May | 26.64 | 27.98 | 1.34 |
| Jun | 26.64 | 27.66 | 1.02 |
| Jul | 26.27 | 27.49 | 1.21 |
| Aug | 26.02 | 27.21 | 1.19 |
| Sep | 25.63 | 26.86 | 1.23 |
| Oct | 25.40 | 26.57 | 1.17 |
| Nov | 25.48 | 26.56 | 1.08 |
| Dec | 25.50 | 26.53 | 1.03 |
| ⌀ Month | 26.12 | 27.30 | 1.18 |
Sunshine (h)
| Month | ⌀ 1940 - 1950 | ⌀ 2013 - 2023 | +/- |
|---|---|---|---|
| Jan | 10.42 | 10.28 | -0.14 |
| Feb | 10.61 | 10.57 | -0.04 |
| Mar | 10.68 | 10.85 | 0.17 |
| Apr | 10.23 | 10.22 | -0.01 |
| May | 9.32 | 9.30 | -0.03 |
| Jun | 8.60 | 8.99 | 0.39 |
| Jul | 8.60 | 8.89 | 0.29 |
| Aug | 8.64 | 9.00 | 0.36 |
| Sep | 7.47 | 8.23 | 0.76 |
| Oct | 7.90 | 8.35 | 0.45 |
| Nov | 9.03 | 8.29 | -0.74 |
| Dec | 9.67 | 9.47 | -0.20 |
| ⌀ Month | 9.27 | 9.37 | 0.10 |
Rain (mm)
| Month | ⌀ 1940 - 1950 | ⌀ 2013 - 2023 | +/- |
|---|---|---|---|
| Jan | 1.48 | 2.35 | 0.88 |
| Feb | 1.90 | 1.25 | -0.65 |
| Mar | 3.32 | 1.53 | -1.79 |
| Apr | 6.50 | 4.34 | -2.16 |
| May | 9.30 | 7.04 | -2.26 |
| Jun | 9.36 | 6.83 | -2.52 |
| Jul | 9.54 | 6.31 | -3.22 |
| Aug | 10.79 | 6.77 | -4.02 |
| Sep | 13.40 | 8.09 | -5.31 |
| Oct | 11.99 | 9.21 | -2.78 |
| Nov | 6.23 | 8.41 | 2.18 |
| Dec | 2.99 | 3.99 | 0.99 |
| ⌀ Month | 7.23 | 5.51 | -1.72 |
Snow (mm)
| Month | ⌀ 1940 - 1950 | ⌀ 2013 - 2023 | +/- |
|---|---|---|---|
| Jan | 0.00 | 0.00 | 0.00 |
| Feb | 0.00 | 0.00 | 0.00 |
| Mar | 0.00 | 0.00 | 0.00 |
| Apr | 0.00 | 0.00 | 0.00 |
| May | 0.00 | 0.00 | 0.00 |
| Jun | 0.00 | 0.00 | 0.00 |
| Jul | 0.00 | 0.00 | 0.00 |
| Aug | 0.00 | 0.00 | 0.00 |
| Sep | 0.00 | 0.00 | 0.00 |
| Oct | 0.00 | 0.00 | 0.00 |
| Nov | 0.00 | 0.00 | 0.00 |
| Dec | 0.00 | 0.00 | 0.00 |
| ⌀ Month | 0.00 | 0.00 | 0.00 |