Climate Chart of Park City, USA
Comprehensive Climate Chart of Park City, USA: Monthly Averages and Weather Trends
Discover the climate of Park City, USA
Park City in the United States experiences a semi-arid climate with cold, snowy winters and warm, dry summers. The average annual precipitation is around 60 inches, with most of it falling as snow during the winter months. Winter temperatures can drop well below freezing, while summer temperatures are generally mild and pleasant.
Best Travel Time Guide for Park City, USA: Ideal Seasons and Weather Insights
The best time to travel to Park City is during the winter months if you enjoy skiing and snow activities. For those who prefer hiking and outdoor adventures, the summer months offer ideal weather conditions. Spring and fall are also great times to visit for pleasant temperatures and fewer crowds.
Climate Data Overview for Park City, USA
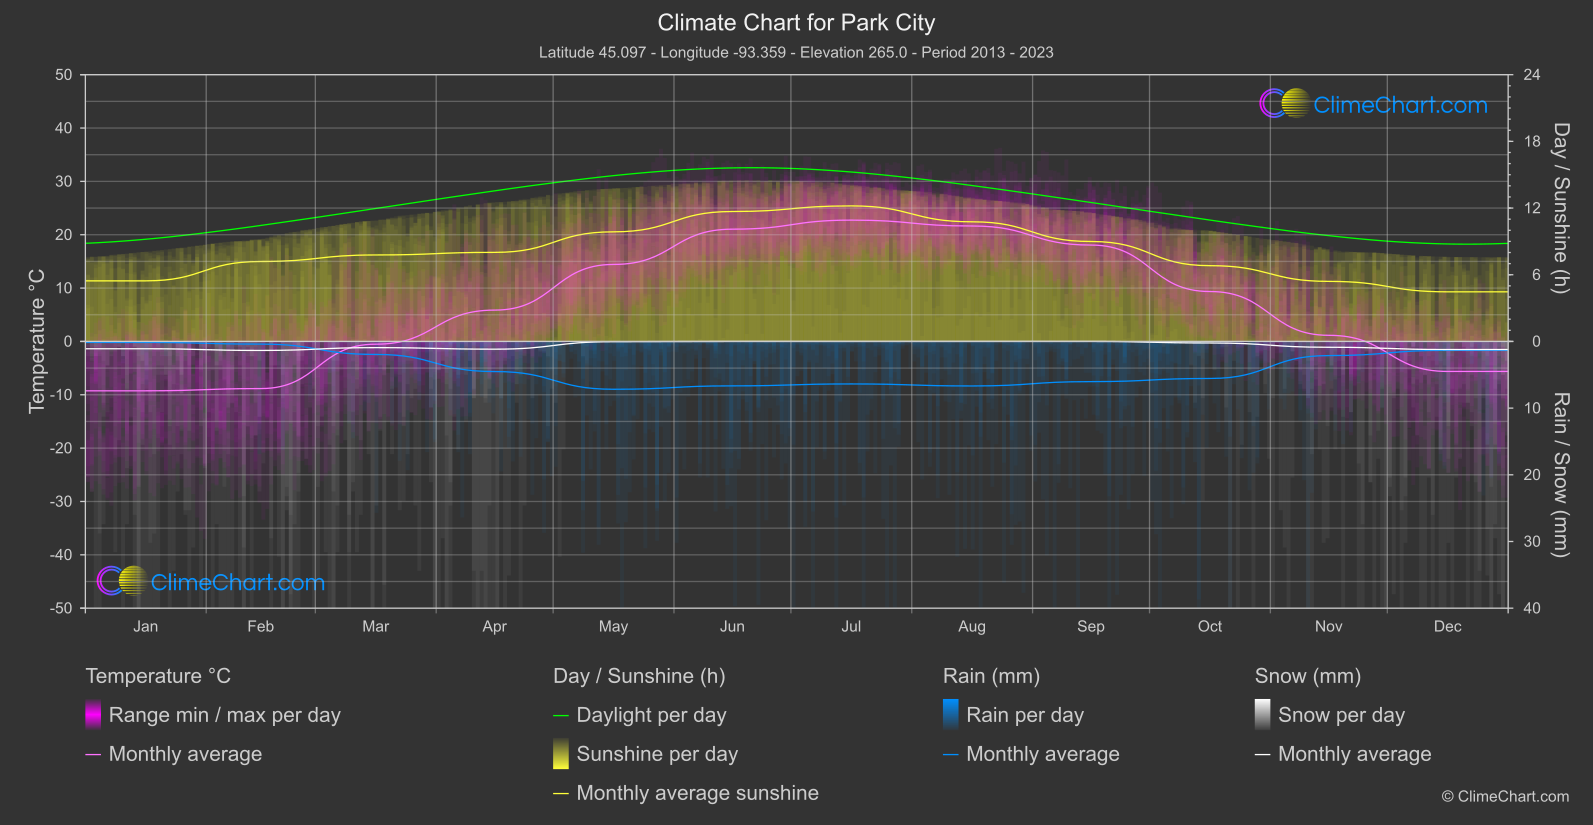
Explore the comprehensive climate data for Park City, USA. This detailed table provides valuable insights into temperature variations, precipitation levels, and seasonal changes, helping you understand the unique weather patterns of this region.
| Month | ⌀ Temperature °C | ⌀ Rain (mm) | ⌀ Snow (mm) | ⌀ Sunshine (h) |
|---|---|---|---|---|
| Jan | -9.3 | 0.07 | 0.55 | 5.45 |
| Feb | -8.8 | 0.20 | 0.68 | 7.19 |
| Mar | -0.5 | 0.97 | 0.47 | 7.78 |
| Apr | 5.9 | 2.26 | 0.58 | 8.01 |
| May | 14.4 | 3.59 | 0.02 | 9.86 |
| Jun | 21.0 | 3.33 | 0.00 | 11.69 |
| Jul | 22.7 | 3.19 | 0.00 | 12.19 |
| Aug | 21.6 | 3.34 | 0.00 | 10.76 |
| Sep | 18.1 | 3.01 | 0.00 | 8.99 |
| Oct | 9.4 | 2.78 | 0.12 | 6.82 |
| Nov | 1.1 | 1.06 | 0.44 | 5.40 |
| Dec | -5.6 | 0.66 | 0.61 | 4.46 |
| ⌀ Month | 7.5 | 2.04 | 0.29 | 8.22 |