Climate Change Chart of Park City, USA
Comprehensive Climate Change Chart of Park City, USA: Monthly Averages and Impact Trends
Exploring the changing climate in Park City, United States of America reveals intriguing insights.
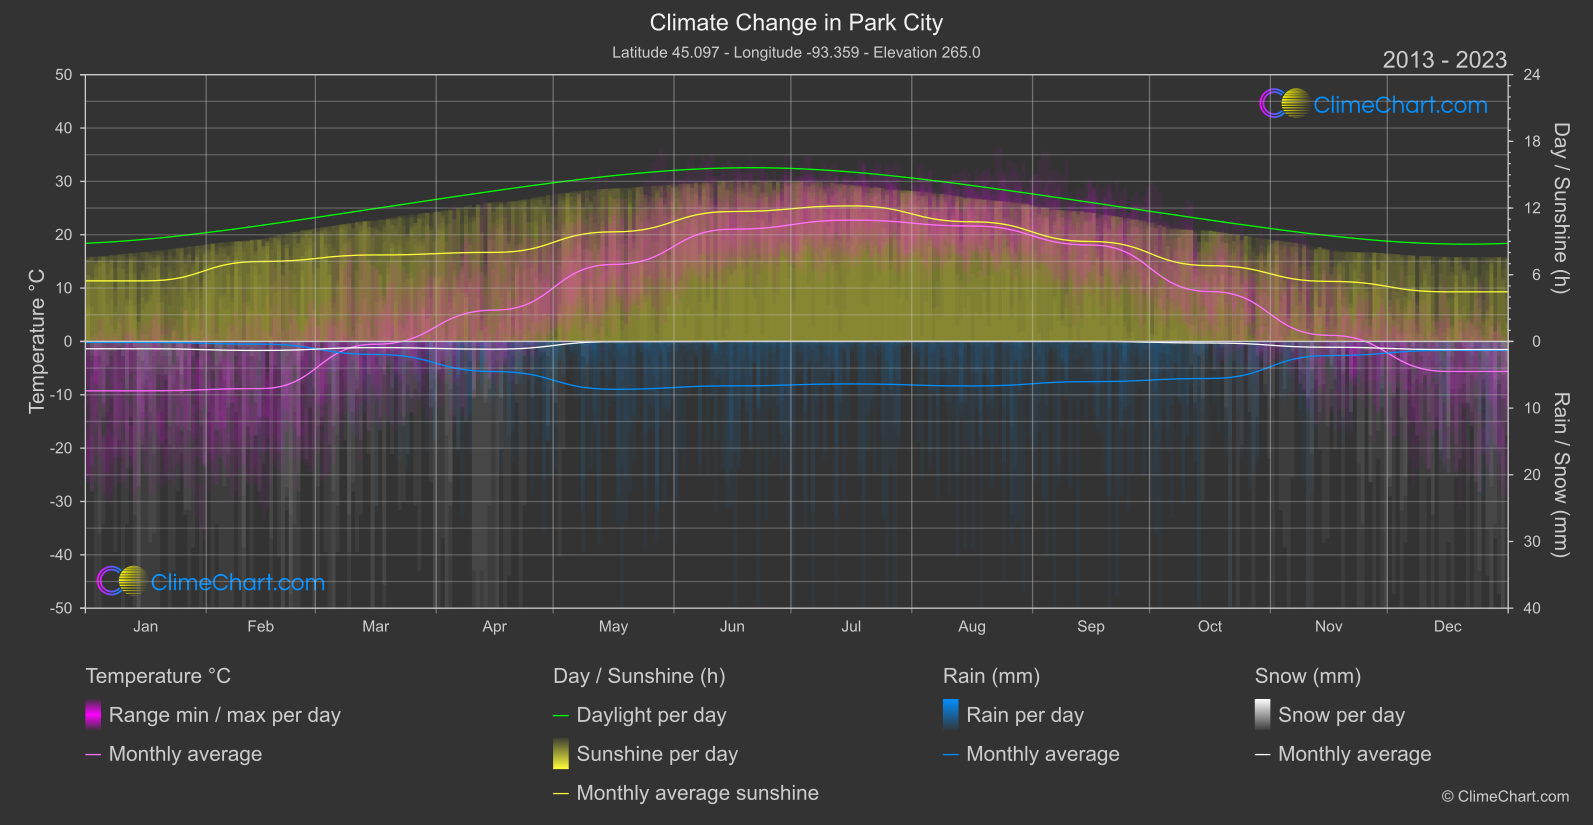
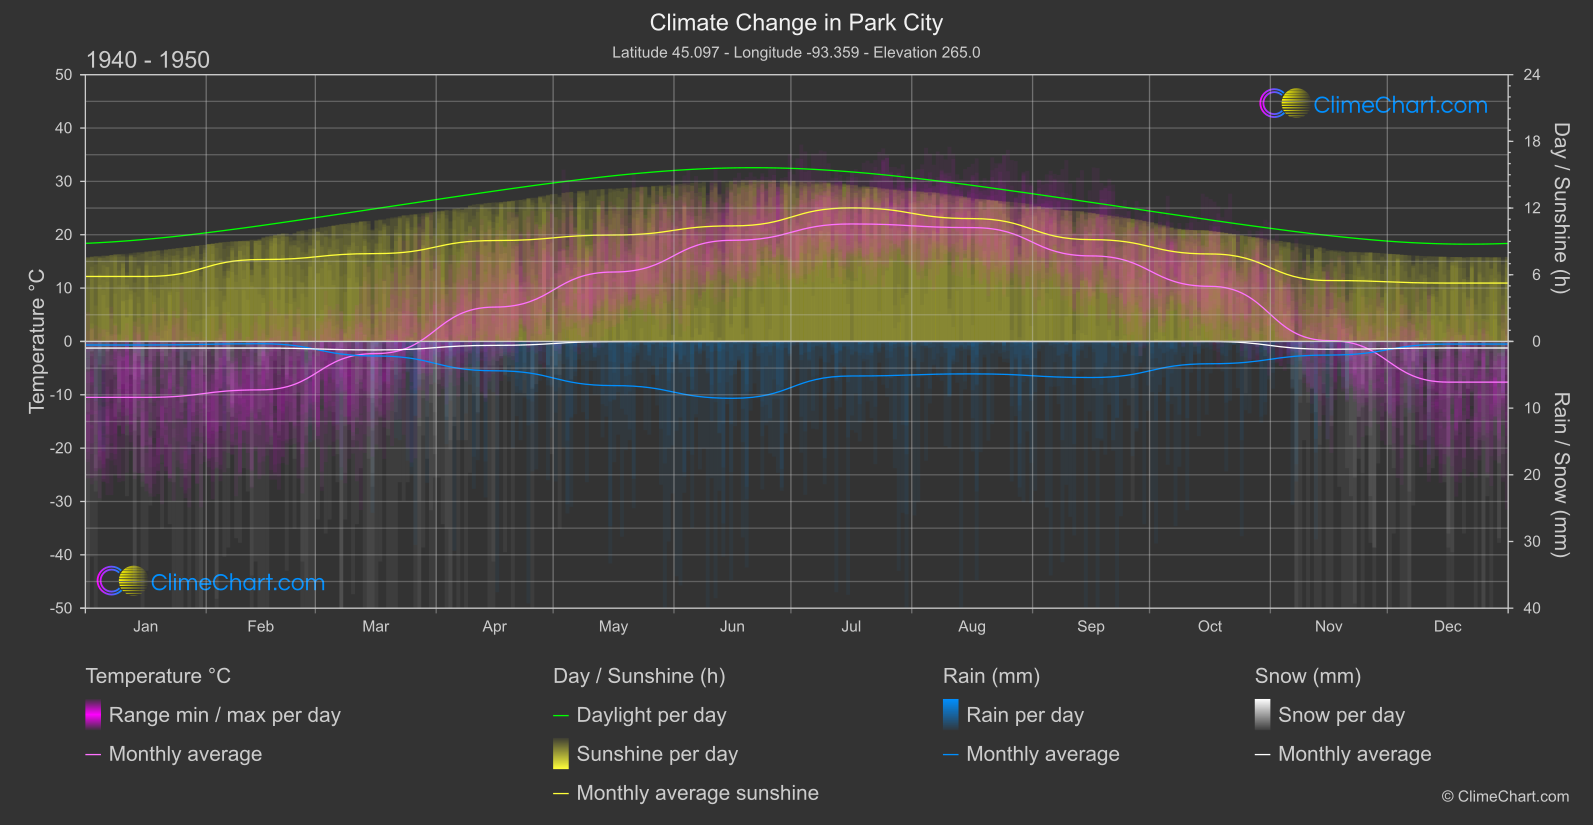
Park City, located in the United States, has experienced notable changes in temperature, rainfall, snowfall, and sunshine duration over the years. Analyzing the data from 1940 to 1950 compared to 2013 to 2024, it is evident that some months have seen significant shifts in climate patterns. For instance, the month with the highest change in temperature was June, with an increase of 2.09°C, while October experienced the most significant increase in rainfall, with a change of 1.10mm. These fluctuations in climate variables underscore the impact of global warming on Park City's weather.
Climate Change Data Overview for Park City, USA
Explore the comprehensive climate change data for Park City, USA. This detailed table provides valuable insights into temperature variations, precipitation levels, and seasonal changes influenced by climate change, helping you understand the unique weather patterns of this region.
Temperature °C
| Month | ⌀ 1940 - 1950 | ⌀ 2013 - 2023 | +/- |
|---|---|---|---|
| Jan | -10.49 | -9.26 | 1.23 |
| Feb | -9.08 | -8.84 | 0.24 |
| Mar | -2.27 | -0.52 | 1.76 |
| Apr | 6.44 | 5.87 | -0.57 |
| May | 13.01 | 14.43 | 1.42 |
| Jun | 18.96 | 21.04 | 2.09 |
| Jul | 22.02 | 22.74 | 0.72 |
| Aug | 21.34 | 21.64 | 0.30 |
| Sep | 16.03 | 18.06 | 2.03 |
| Oct | 10.33 | 9.36 | -0.98 |
| Nov | 0.16 | 1.15 | 0.99 |
| Dec | -7.63 | -5.63 | 2.00 |
| ⌀ Month | 6.57 | 7.50 | 0.94 |
Sunshine (h)
| Month | ⌀ 1940 - 1950 | ⌀ 2013 - 2023 | +/- |
|---|---|---|---|
| Jan | 5.85 | 5.45 | -0.40 |
| Feb | 7.37 | 7.19 | -0.18 |
| Mar | 7.90 | 7.78 | -0.12 |
| Apr | 9.08 | 8.01 | -1.06 |
| May | 9.58 | 9.86 | 0.29 |
| Jun | 10.40 | 11.69 | 1.29 |
| Jul | 12.02 | 12.19 | 0.18 |
| Aug | 11.05 | 10.76 | -0.29 |
| Sep | 9.16 | 8.99 | -0.17 |
| Oct | 7.87 | 6.82 | -1.05 |
| Nov | 5.48 | 5.40 | -0.08 |
| Dec | 5.25 | 4.46 | -0.79 |
| ⌀ Month | 8.42 | 8.22 | -0.20 |
Rain (mm)
| Month | ⌀ 1940 - 1950 | ⌀ 2013 - 2023 | +/- |
|---|---|---|---|
| Jan | 0.27 | 0.07 | -0.19 |
| Feb | 0.17 | 0.20 | 0.03 |
| Mar | 1.09 | 0.97 | -0.12 |
| Apr | 2.20 | 2.26 | 0.06 |
| May | 3.31 | 3.59 | 0.28 |
| Jun | 4.26 | 3.33 | -0.93 |
| Jul | 2.59 | 3.19 | 0.60 |
| Aug | 2.43 | 3.34 | 0.91 |
| Sep | 2.71 | 3.01 | 0.31 |
| Oct | 1.67 | 2.78 | 1.10 |
| Nov | 1.02 | 1.06 | 0.04 |
| Dec | 0.20 | 0.66 | 0.46 |
| ⌀ Month | 1.83 | 2.04 | 0.21 |
Snow (mm)
| Month | ⌀ 1940 - 1950 | ⌀ 2013 - 2023 | +/- |
|---|---|---|---|
| Jan | 0.50 | 0.55 | 0.05 |
| Feb | 0.50 | 0.68 | 0.18 |
| Mar | 0.64 | 0.47 | -0.17 |
| Apr | 0.30 | 0.58 | 0.29 |
| May | 0.01 | 0.02 | 0.01 |
| Jun | 0.00 | 0.00 | 0.00 |
| Jul | 0.00 | 0.00 | 0.00 |
| Aug | 0.00 | 0.00 | 0.00 |
| Sep | 0.01 | 0.00 | -0.01 |
| Oct | 0.00 | 0.12 | 0.11 |
| Nov | 0.58 | 0.44 | -0.15 |
| Dec | 0.49 | 0.61 | 0.12 |
| ⌀ Month | 0.25 | 0.29 | 0.04 |