Climate Chart of Oxford, Great Britain
Comprehensive Climate Chart of Oxford, Great Britain: Monthly Averages and Weather Trends
Explore the climate and weather of Oxford, United Kingdom.
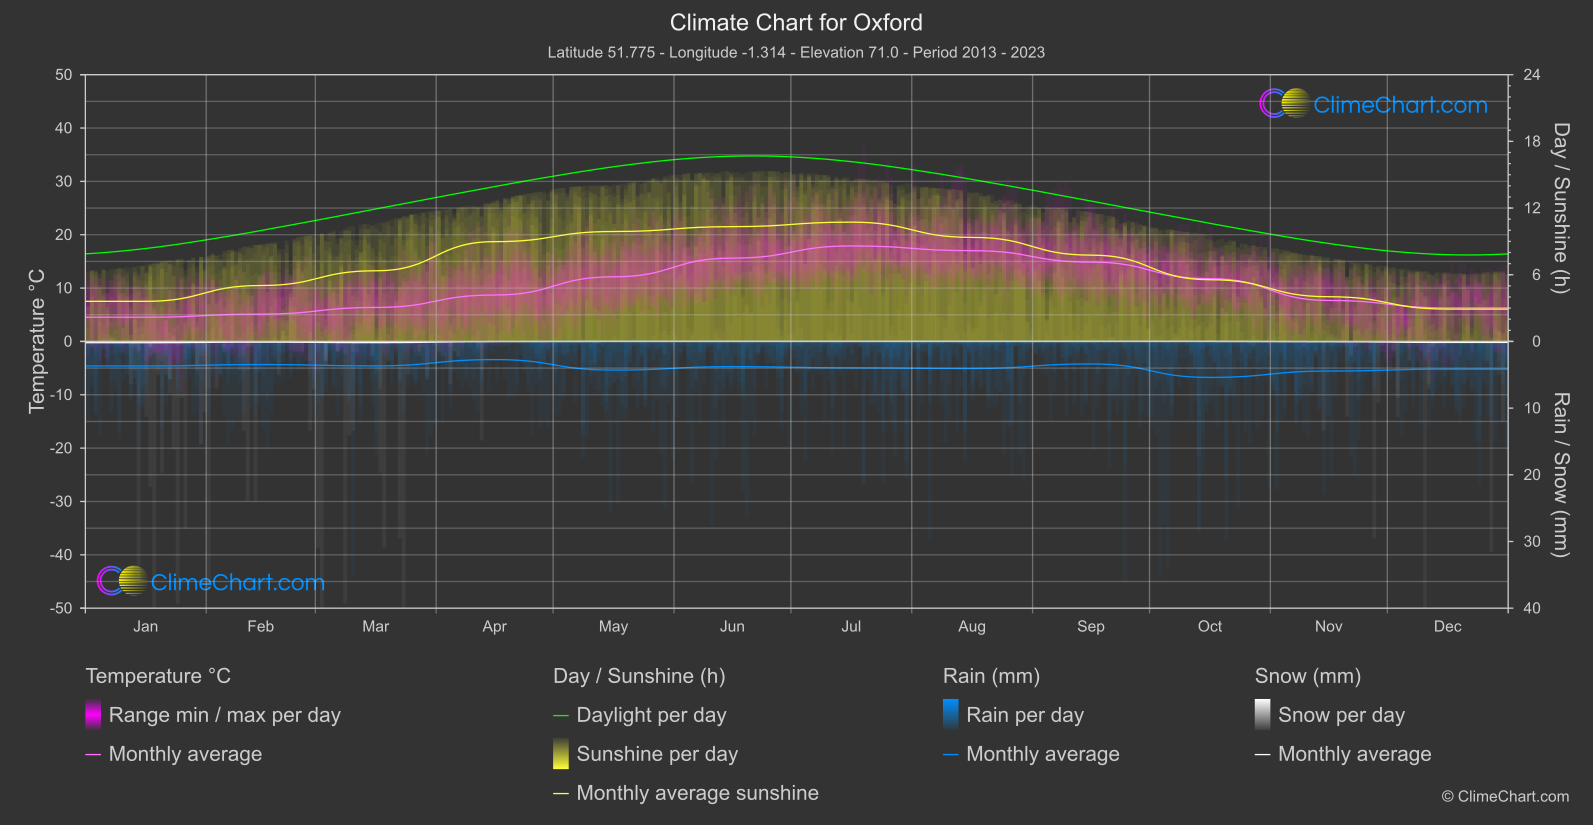
Oxford, located in the United Kingdom, experiences a temperate maritime climate with mild summers and cool winters. The average annual temperature is around 10°C, with July being the warmest month and January the coldest. Rainfall is evenly distributed throughout the year, with October being the wettest month. Snowfall is rare in Oxford due to its proximity to the coast.
Best Travel Time Guide for Oxford, Great Britain: Ideal Seasons and Weather Insights
The best time to visit Oxford is during the late spring and summer months, from May to August, when the weather is pleasant for outdoor activities and sightseeing. Autumn, particularly September and October, also offers mild temperatures and beautiful foliage for visitors to enjoy. Winter in Oxford can be chilly, but the festive atmosphere during the holiday season makes it a charming time to explore the city.
Climate Data Overview for Oxford, Great Britain
Explore the comprehensive climate data for Oxford, Great Britain. This detailed table provides valuable insights into temperature variations, precipitation levels, and seasonal changes, helping you understand the unique weather patterns of this region.
| Month | ⌀ Temperature °C | ⌀ Rain (mm) | ⌀ Snow (mm) | ⌀ Sunshine (h) |
|---|---|---|---|---|
| Jan | 4.5 | 1.84 | 0.10 | 3.61 |
| Feb | 5.1 | 1.73 | 0.05 | 5.03 |
| Mar | 6.4 | 1.83 | 0.09 | 6.36 |
| Apr | 8.7 | 1.36 | 0.01 | 8.98 |
| May | 12.1 | 2.15 | 0.00 | 9.89 |
| Jun | 15.6 | 1.89 | 0.00 | 10.33 |
| Jul | 17.9 | 1.98 | 0.00 | 10.73 |
| Aug | 17.0 | 2.03 | 0.00 | 9.36 |
| Sep | 14.9 | 1.69 | 0.00 | 7.77 |
| Oct | 11.8 | 2.70 | 0.00 | 5.55 |
| Nov | 7.7 | 2.22 | 0.02 | 4.02 |
| Dec | 6.3 | 2.08 | 0.08 | 2.91 |
| ⌀ Month | 10.7 | 1.96 | 0.03 | 7.05 |