Climate Change Chart of Oxford, Great Britain
Comprehensive Climate Change Chart of Oxford, Great Britain: Monthly Averages and Impact Trends
Exploring the changing climate in Oxford, United Kingdom reveals intriguing insights.
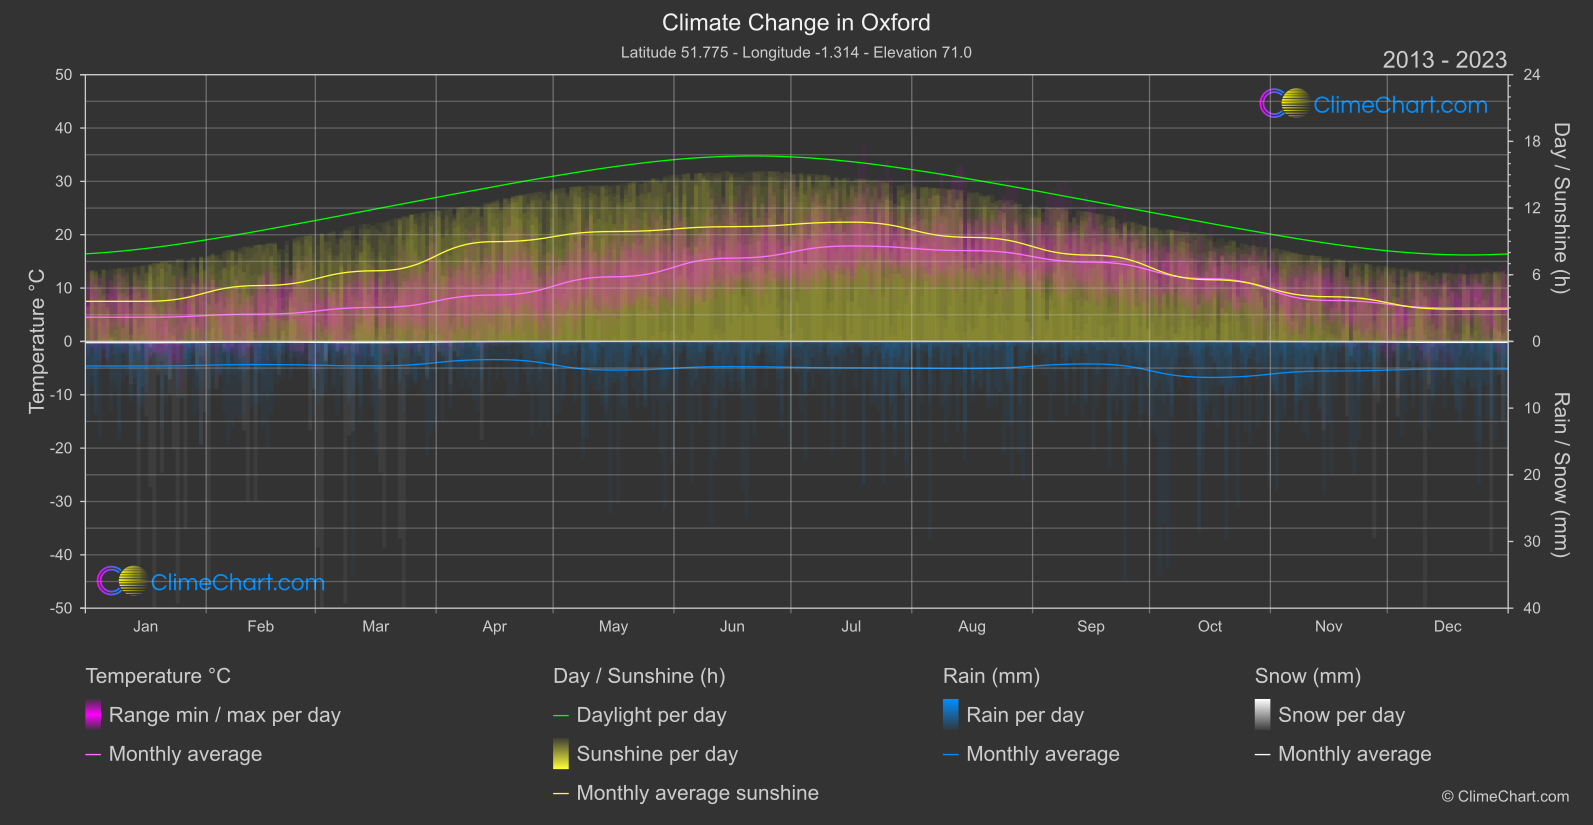
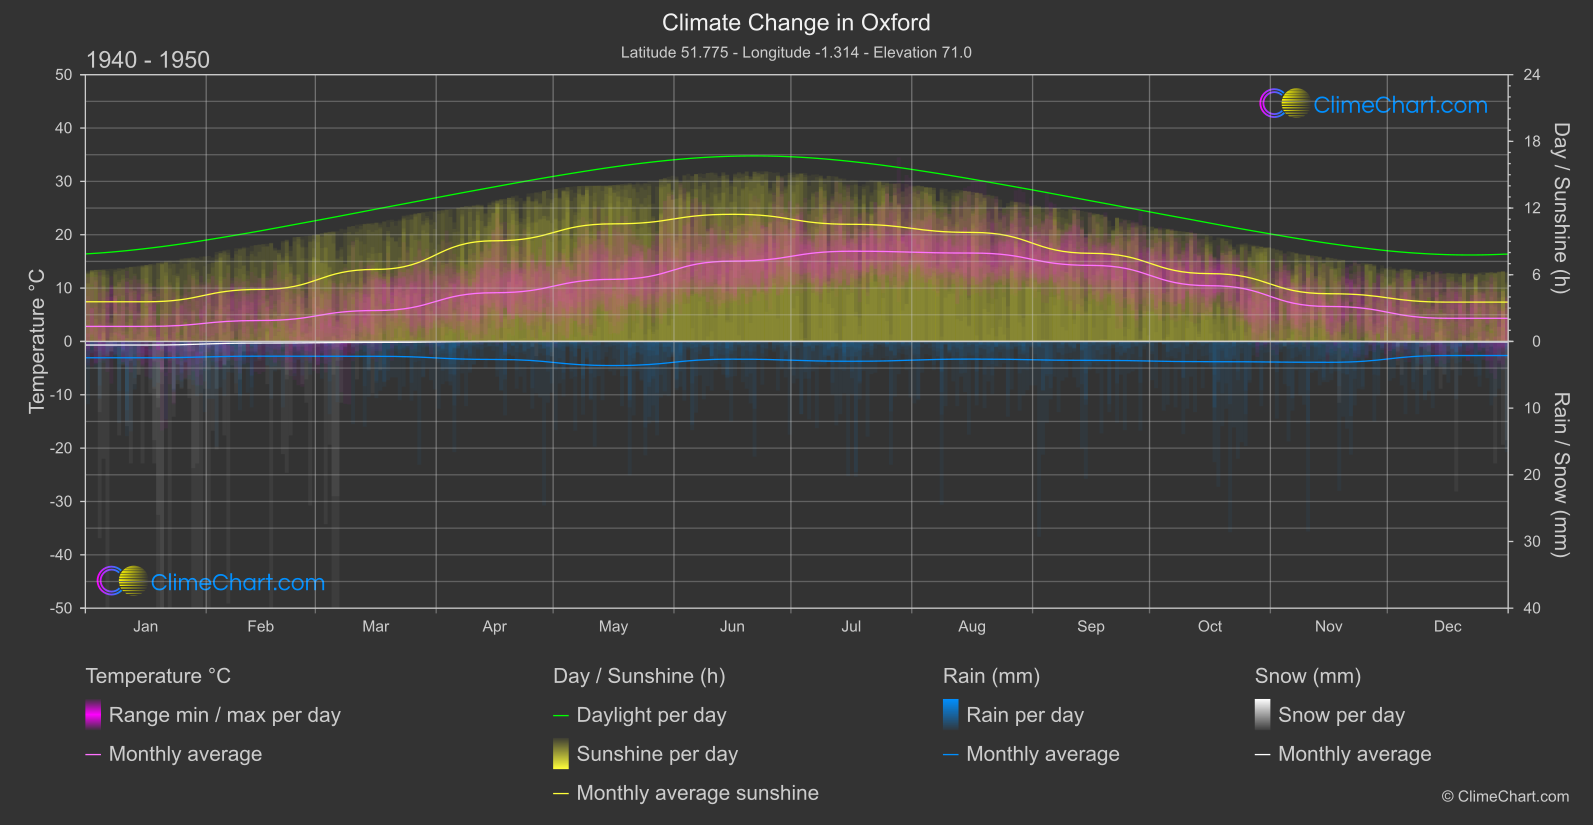
Oxford, United Kingdom of Great Britain and Northern Ireland, experiences significant shifts in temperature, rainfall, snowfall, and sunshine duration. From the data analysis, it is evident that the month of December has shown the highest temperature change of 1.94°C compared to the period of 1940-1950. Additionally, the month of October exhibits the highest increase in rainfall with a change of 1.18mm. The snowfall and sunshine duration also depict varying trends over the years, reflecting the evolving climate patterns in Oxford.
Climate Change Data Overview for Oxford, Great Britain
Explore the comprehensive climate change data for Oxford, Great Britain. This detailed table provides valuable insights into temperature variations, precipitation levels, and seasonal changes influenced by climate change, helping you understand the unique weather patterns of this region.
Temperature °C
| Month | ⌀ 1940 - 1950 | ⌀ 2013 - 2023 | +/- |
|---|---|---|---|
| Jan | 2.82 | 4.54 | 1.72 |
| Feb | 3.92 | 5.12 | 1.19 |
| Mar | 5.79 | 6.37 | 0.58 |
| Apr | 9.13 | 8.70 | -0.43 |
| May | 11.64 | 12.11 | 0.47 |
| Jun | 15.05 | 15.62 | 0.57 |
| Jul | 16.90 | 17.90 | 0.99 |
| Aug | 16.56 | 17.01 | 0.44 |
| Sep | 14.26 | 14.87 | 0.61 |
| Oct | 10.45 | 11.76 | 1.31 |
| Nov | 6.55 | 7.68 | 1.13 |
| Dec | 4.34 | 6.28 | 1.94 |
| ⌀ Month | 9.78 | 10.66 | 0.88 |
Sunshine (h)
| Month | ⌀ 1940 - 1950 | ⌀ 2013 - 2023 | +/- |
|---|---|---|---|
| Jan | 3.57 | 3.61 | 0.04 |
| Feb | 4.68 | 5.03 | 0.35 |
| Mar | 6.48 | 6.36 | -0.12 |
| Apr | 9.05 | 8.98 | -0.08 |
| May | 10.58 | 9.89 | -0.69 |
| Jun | 11.44 | 10.33 | -1.11 |
| Jul | 10.54 | 10.73 | 0.19 |
| Aug | 9.81 | 9.36 | -0.45 |
| Sep | 7.93 | 7.77 | -0.16 |
| Oct | 6.10 | 5.55 | -0.55 |
| Nov | 4.29 | 4.02 | -0.27 |
| Dec | 3.54 | 2.91 | -0.63 |
| ⌀ Month | 7.33 | 7.04 | -0.29 |
Rain (mm)
| Month | ⌀ 1940 - 1950 | ⌀ 2013 - 2023 | +/- |
|---|---|---|---|
| Jan | 1.23 | 1.84 | 0.61 |
| Feb | 1.11 | 1.73 | 0.63 |
| Mar | 1.12 | 1.83 | 0.72 |
| Apr | 1.35 | 1.36 | 0.01 |
| May | 1.81 | 2.15 | 0.34 |
| Jun | 1.33 | 1.89 | 0.56 |
| Jul | 1.49 | 1.98 | 0.50 |
| Aug | 1.32 | 2.03 | 0.71 |
| Sep | 1.42 | 1.69 | 0.27 |
| Oct | 1.52 | 2.70 | 1.18 |
| Nov | 1.56 | 2.22 | 0.66 |
| Dec | 1.06 | 2.08 | 1.02 |
| ⌀ Month | 1.36 | 1.96 | 0.60 |
Snow (mm)
| Month | ⌀ 1940 - 1950 | ⌀ 2013 - 2023 | +/- |
|---|---|---|---|
| Jan | 0.27 | 0.10 | -0.18 |
| Feb | 0.12 | 0.05 | -0.07 |
| Mar | 0.07 | 0.09 | 0.02 |
| Apr | 0.00 | 0.01 | 0.01 |
| May | 0.00 | 0.00 | 0.00 |
| Jun | 0.00 | 0.00 | 0.00 |
| Jul | 0.00 | 0.00 | 0.00 |
| Aug | 0.00 | 0.00 | 0.00 |
| Sep | 0.00 | 0.00 | 0.00 |
| Oct | 0.00 | 0.00 | 0.00 |
| Nov | 0.00 | 0.02 | 0.02 |
| Dec | 0.04 | 0.08 | 0.03 |
| ⌀ Month | 0.04 | 0.03 | -0.01 |