Climate Chart of Mossul, Iraq
Comprehensive Climate Chart of Mossul, Iraq: Monthly Averages and Weather Trends
Discover the Climate of Mossul, Iraq
Mossul, located in Iraq, experiences a hot desert climate with extremely high temperatures during the summer months. Winters are mild and can occasionally have some rainfall. The city is known for its dry and arid conditions, with very little humidity throughout the year.
Best Travel Time Guide for Mossul, Iraq: Ideal Seasons and Weather Insights
The best time to travel to Mossul is during the winter months when the temperatures are milder and more suitable for exploring the city. Avoid visiting during the scorching summer months when temperatures can soar to extreme levels.
Climate Data Overview for Mossul, Iraq
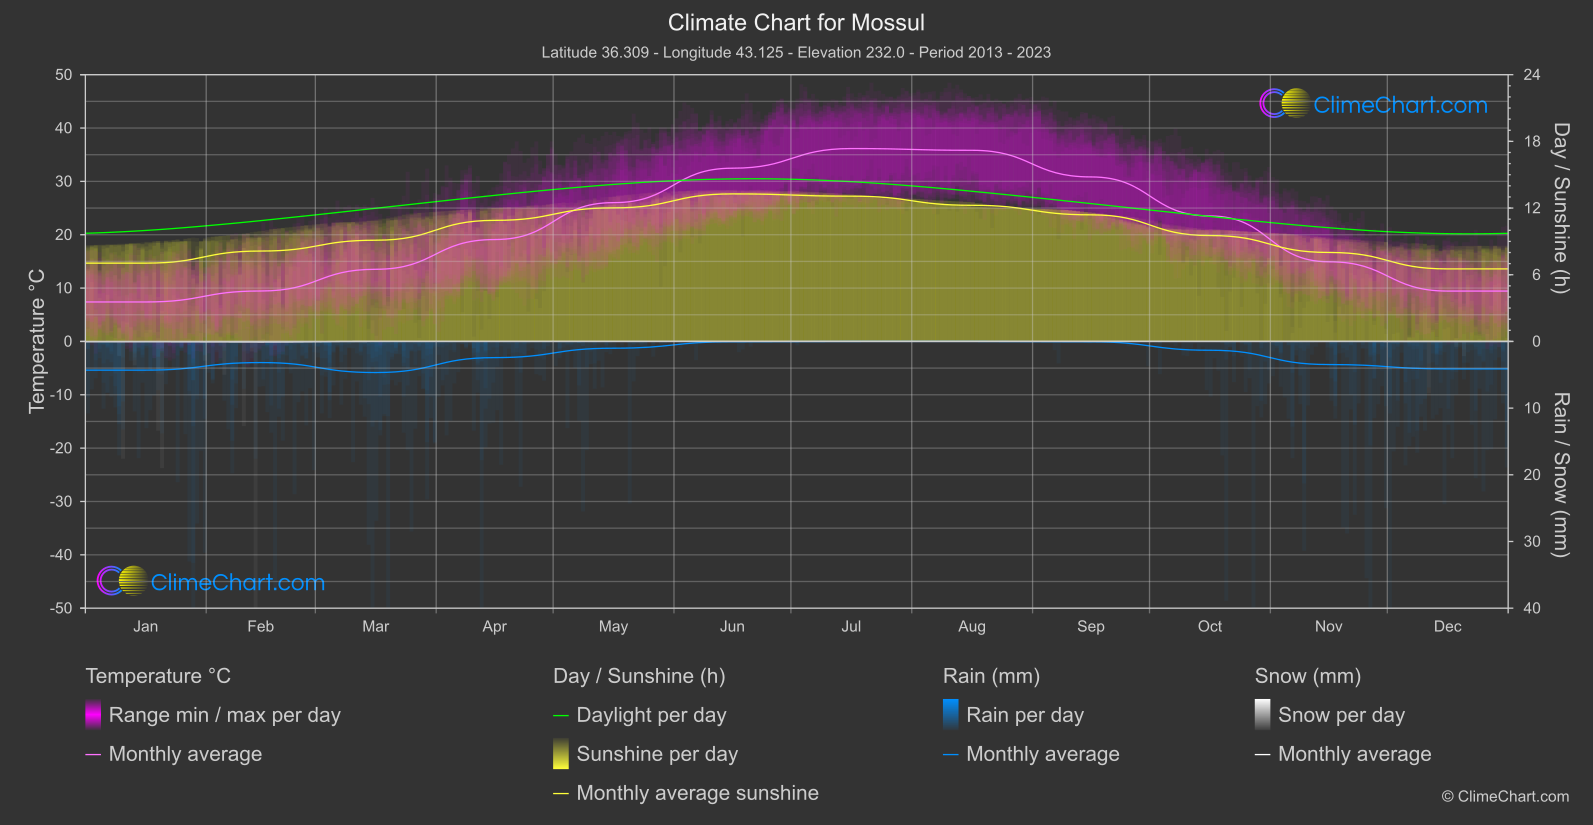
Explore the comprehensive climate data for Mossul, Iraq. This detailed table provides valuable insights into temperature variations, precipitation levels, and seasonal changes, helping you understand the unique weather patterns of this region.
| Month | ⌀ Temperature °C | ⌀ Rain (mm) | ⌀ Snow (mm) | ⌀ Sunshine (h) |
|---|---|---|---|---|
| Jan | 7.4 | 2.15 | 0.02 | 7.04 |
| Feb | 9.5 | 1.58 | 0.04 | 8.13 |
| Mar | 13.5 | 2.33 | 0.00 | 9.11 |
| Apr | 19.1 | 1.21 | 0.00 | 10.89 |
| May | 26.0 | 0.51 | 0.00 | 12.02 |
| Jun | 32.5 | 0.02 | 0.00 | 13.27 |
| Jul | 36.2 | 0.00 | 0.00 | 13.07 |
| Aug | 35.8 | 0.00 | 0.00 | 12.25 |
| Sep | 30.8 | 0.03 | 0.00 | 11.39 |
| Oct | 23.5 | 0.66 | 0.00 | 9.53 |
| Nov | 14.9 | 1.73 | 0.00 | 8.01 |
| Dec | 9.4 | 2.06 | 0.00 | 6.52 |
| ⌀ Month | 21.6 | 1.02 | 0.01 | 10.10 |