Climate Change Chart of Mossul, Iraq
Comprehensive Climate Change Chart of Mossul, Iraq: Monthly Averages and Impact Trends
Discover the changing climate in Mosul, Iraq with insightful data analysis.
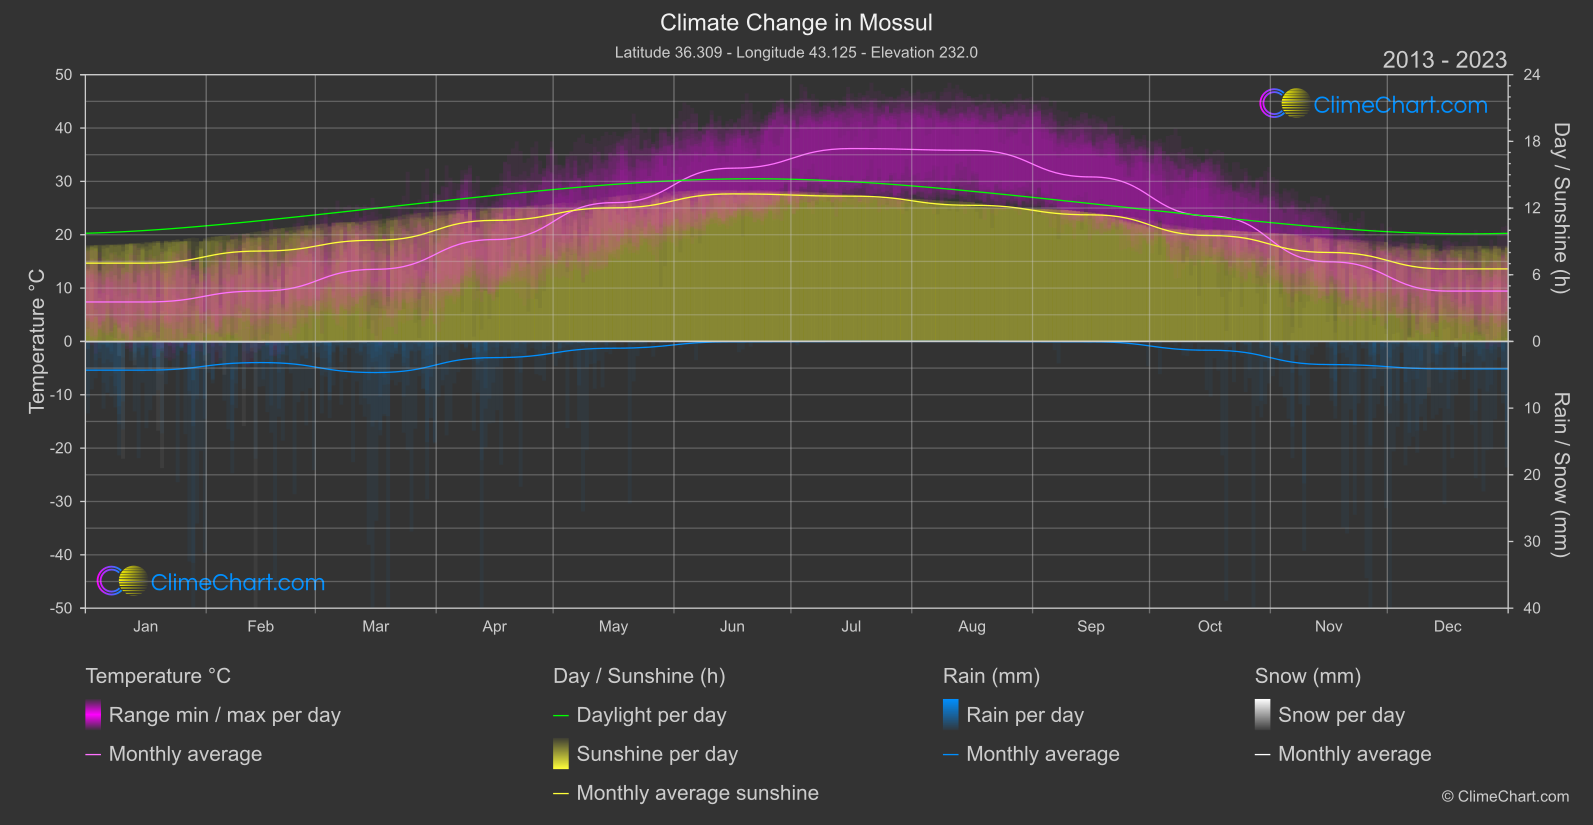

Mosul, Iraq experiences varying temperatures and rainfall patterns. The data from 1940-1950 compared to 2013-2024 shows significant changes. For temperature, the month with the highest change is August, with a 1.45°C increase. In terms of rainfall, October sees the most substantial change with a 0.48mm increase. Explore how climate change is impacting Mosul's weather over the years.
Climate Change Data Overview for Mossul, Iraq
Explore the comprehensive climate change data for Mossul, Iraq. This detailed table provides valuable insights into temperature variations, precipitation levels, and seasonal changes influenced by climate change, helping you understand the unique weather patterns of this region.
Temperature °C
| Month | ⌀ 1940 - 1950 | ⌀ 2013 - 2023 | +/- |
|---|---|---|---|
| Jan | 6.66 | 7.40 | 0.74 |
| Feb | 8.15 | 9.45 | 1.30 |
| Mar | 11.73 | 13.52 | 1.79 |
| Apr | 18.20 | 19.10 | 0.90 |
| May | 25.51 | 26.02 | 0.51 |
| Jun | 31.67 | 32.47 | 0.81 |
| Jul | 35.31 | 36.15 | 0.84 |
| Aug | 34.37 | 35.83 | 1.45 |
| Sep | 29.74 | 30.84 | 1.10 |
| Oct | 22.73 | 23.51 | 0.78 |
| Nov | 15.73 | 14.93 | -0.80 |
| Dec | 9.09 | 9.44 | 0.35 |
| ⌀ Month | 20.74 | 21.56 | 0.81 |
Sunshine (h)
| Month | ⌀ 1940 - 1950 | ⌀ 2013 - 2023 | +/- |
|---|---|---|---|
| Jan | 6.92 | 7.04 | 0.13 |
| Feb | 8.49 | 8.13 | -0.36 |
| Mar | 9.59 | 9.11 | -0.49 |
| Apr | 11.23 | 10.89 | -0.34 |
| May | 12.32 | 12.02 | -0.31 |
| Jun | 13.54 | 13.27 | -0.27 |
| Jul | 13.24 | 13.07 | -0.17 |
| Aug | 12.44 | 12.25 | -0.19 |
| Sep | 11.53 | 11.39 | -0.14 |
| Oct | 10.00 | 9.53 | -0.47 |
| Nov | 8.59 | 8.01 | -0.58 |
| Dec | 7.16 | 6.52 | -0.64 |
| ⌀ Month | 10.42 | 10.10 | -0.32 |
Rain (mm)
| Month | ⌀ 1940 - 1950 | ⌀ 2013 - 2023 | +/- |
|---|---|---|---|
| Jan | 2.47 | 2.15 | -0.32 |
| Feb | 1.77 | 1.58 | -0.19 |
| Mar | 2.11 | 2.33 | 0.23 |
| Apr | 1.42 | 1.21 | -0.21 |
| May | 0.81 | 0.51 | -0.30 |
| Jun | 0.01 | 0.02 | 0.02 |
| Jul | 0.00 | 0.00 | 0.00 |
| Aug | 0.00 | 0.00 | 0.00 |
| Sep | 0.01 | 0.03 | 0.02 |
| Oct | 0.18 | 0.66 | 0.48 |
| Nov | 0.89 | 1.73 | 0.84 |
| Dec | 2.00 | 2.06 | 0.06 |
| ⌀ Month | 0.97 | 1.02 | 0.05 |
Snow (mm)
| Month | ⌀ 1940 - 1950 | ⌀ 2013 - 2023 | +/- |
|---|---|---|---|
| Jan | 0.04 | 0.02 | -0.02 |
| Feb | 0.04 | 0.04 | -0.01 |
| Mar | 0.00 | 0.00 | 0.00 |
| Apr | 0.00 | 0.00 | 0.00 |
| May | 0.00 | 0.00 | 0.00 |
| Jun | 0.00 | 0.00 | 0.00 |
| Jul | 0.00 | 0.00 | 0.00 |
| Aug | 0.00 | 0.00 | 0.00 |
| Sep | 0.00 | 0.00 | 0.00 |
| Oct | 0.00 | 0.00 | 0.00 |
| Nov | 0.00 | 0.00 | 0.00 |
| Dec | 0.00 | 0.00 | 0.00 |
| ⌀ Month | 0.01 | 0.00 | -0.00 |