Climate Chart of Miami, USA
Comprehensive Climate Chart of Miami, USA: Monthly Averages and Weather Trends
Welcome to Miami, United States of America! Discover the vibrant city known for its sunny weather and beautiful beaches.
Miami, located in the state of Florida, enjoys a tropical monsoon climate with warm and humid summers and mild winters. The city experiences abundant sunshine throughout the year, with occasional rainfall, especially during the wet season from May to October. Hurricanes can also affect the region between June and November. The average annual temperature in Miami is around 77°F (25°C), making it a popular destination for beachgoers and outdoor enthusiasts.
Best Travel Time Guide for Miami, USA: Ideal Seasons and Weather Insights
The best time to travel to Miami is during the dry season from November to April when the weather is pleasant and there is minimal rainfall. This period offers ideal conditions for exploring the city, enjoying outdoor activities, and relaxing on the beaches. However, if you prefer a more vibrant atmosphere with various events and festivals, visiting during the summer months can also be a great experience despite the higher humidity levels.
Climate Data Overview for Miami, USA
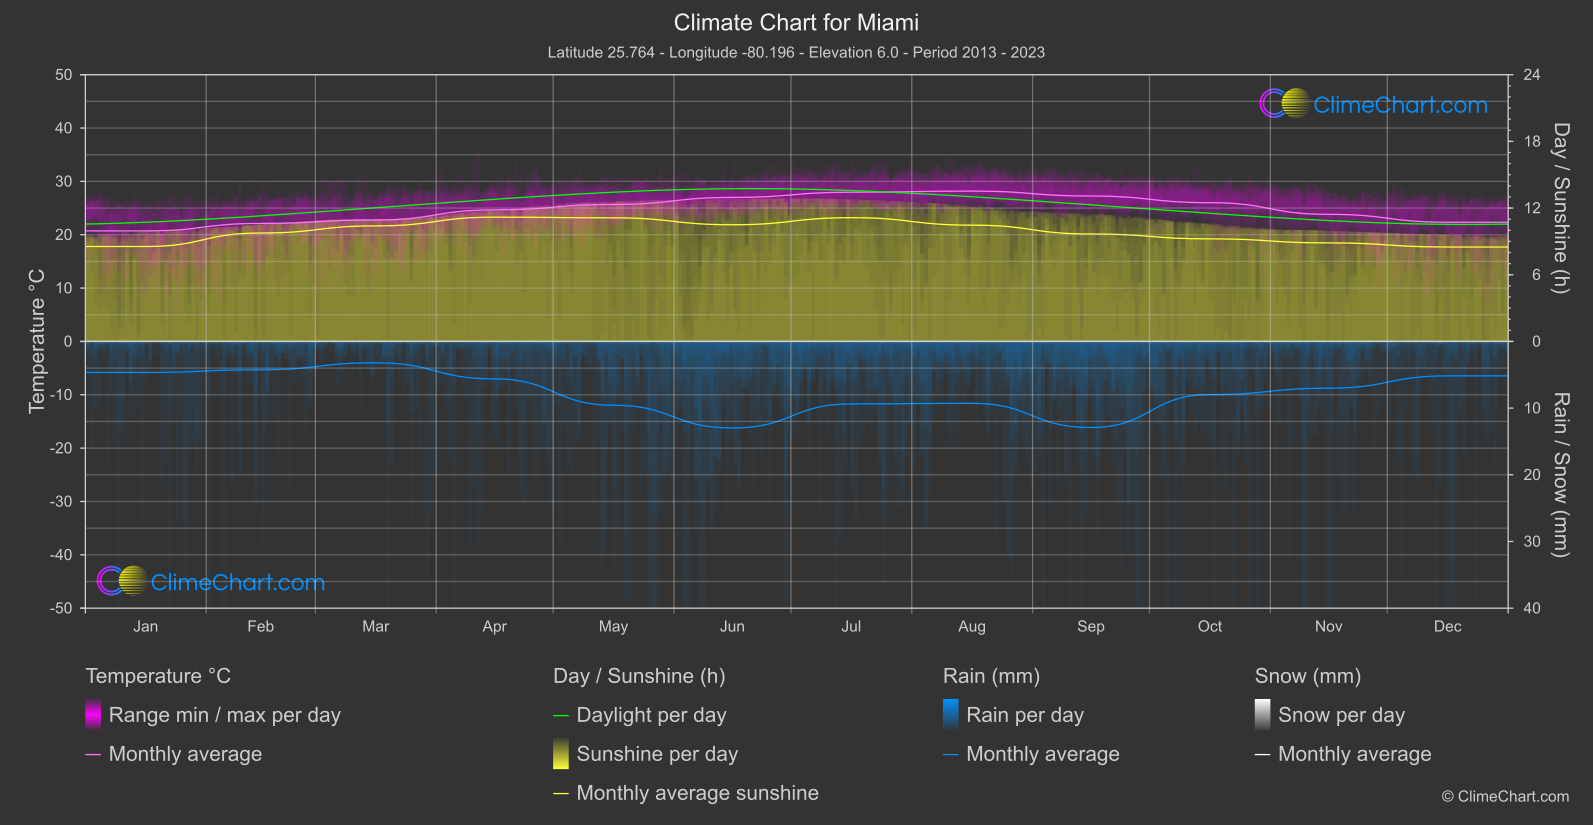
Explore the comprehensive climate data for Miami, USA. This detailed table provides valuable insights into temperature variations, precipitation levels, and seasonal changes, helping you understand the unique weather patterns of this region.
| Month | ⌀ Temperature °C | ⌀ Rain (mm) | ⌀ Snow (mm) | ⌀ Sunshine (h) |
|---|---|---|---|---|
| Jan | 20.7 | 2.33 | 0.00 | 8.54 |
| Feb | 22.1 | 2.13 | 0.00 | 9.75 |
| Mar | 22.8 | 1.60 | 0.00 | 10.39 |
| Apr | 24.7 | 2.81 | 0.00 | 11.18 |
| May | 25.7 | 4.78 | 0.00 | 11.12 |
| Jun | 27.0 | 6.49 | 0.00 | 10.50 |
| Jul | 28.0 | 4.68 | 0.00 | 11.13 |
| Aug | 28.2 | 4.64 | 0.00 | 10.46 |
| Sep | 27.3 | 6.45 | 0.00 | 9.67 |
| Oct | 26.0 | 3.98 | 0.00 | 9.23 |
| Nov | 23.8 | 3.51 | 0.00 | 8.86 |
| Dec | 22.3 | 2.58 | 0.00 | 8.49 |
| ⌀ Month | 24.9 | 3.83 | 0.00 | 9.94 |