Climate Change Chart of Miami, USA
Comprehensive Climate Change Chart of Miami, USA: Monthly Averages and Impact Trends
Exploring the changing climate patterns in Miami, USA reveals intriguing insights.
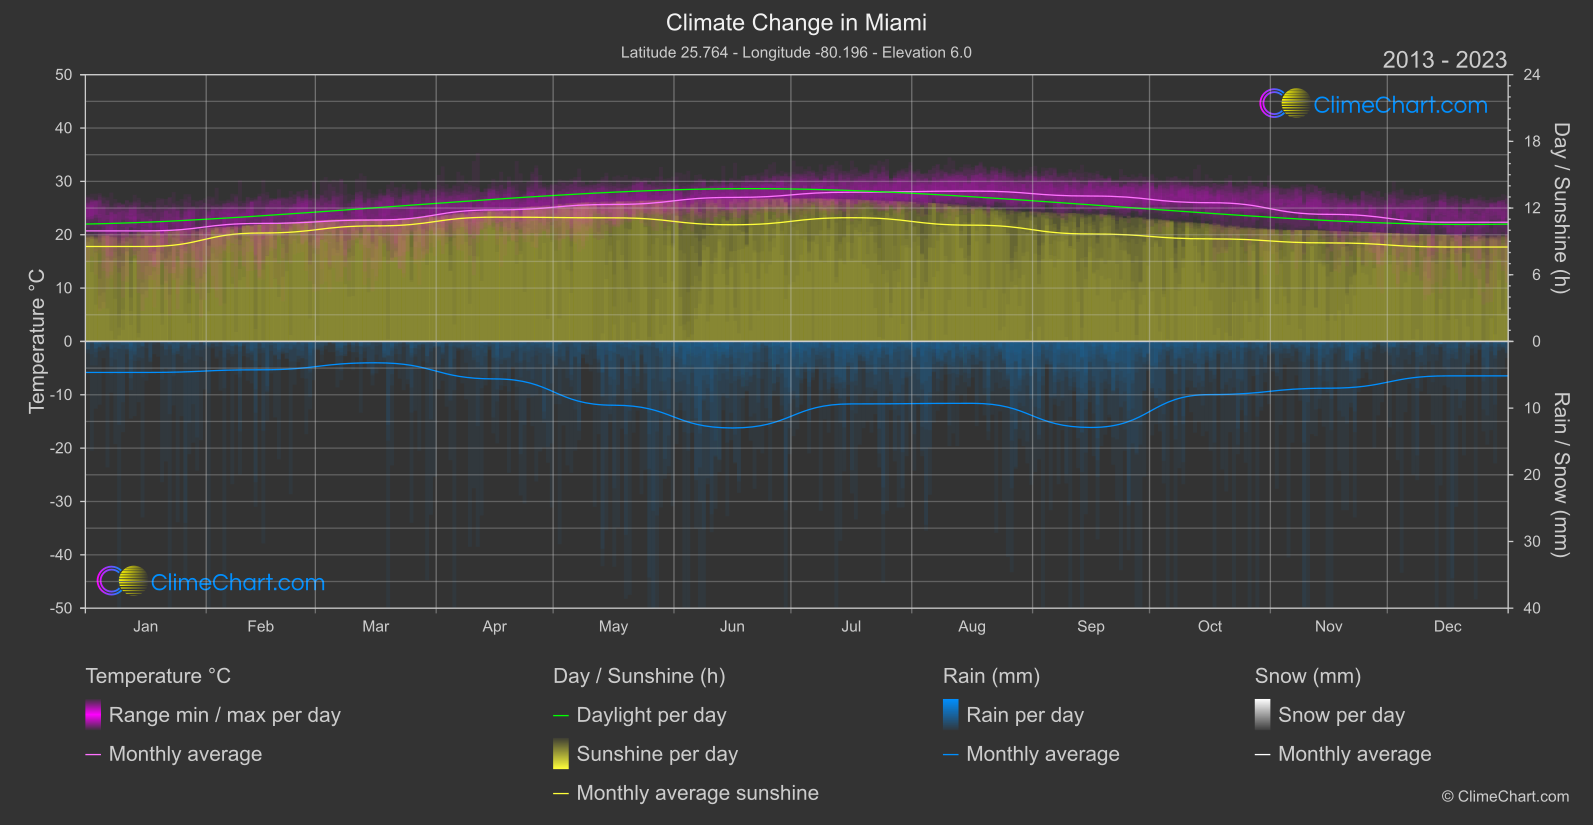
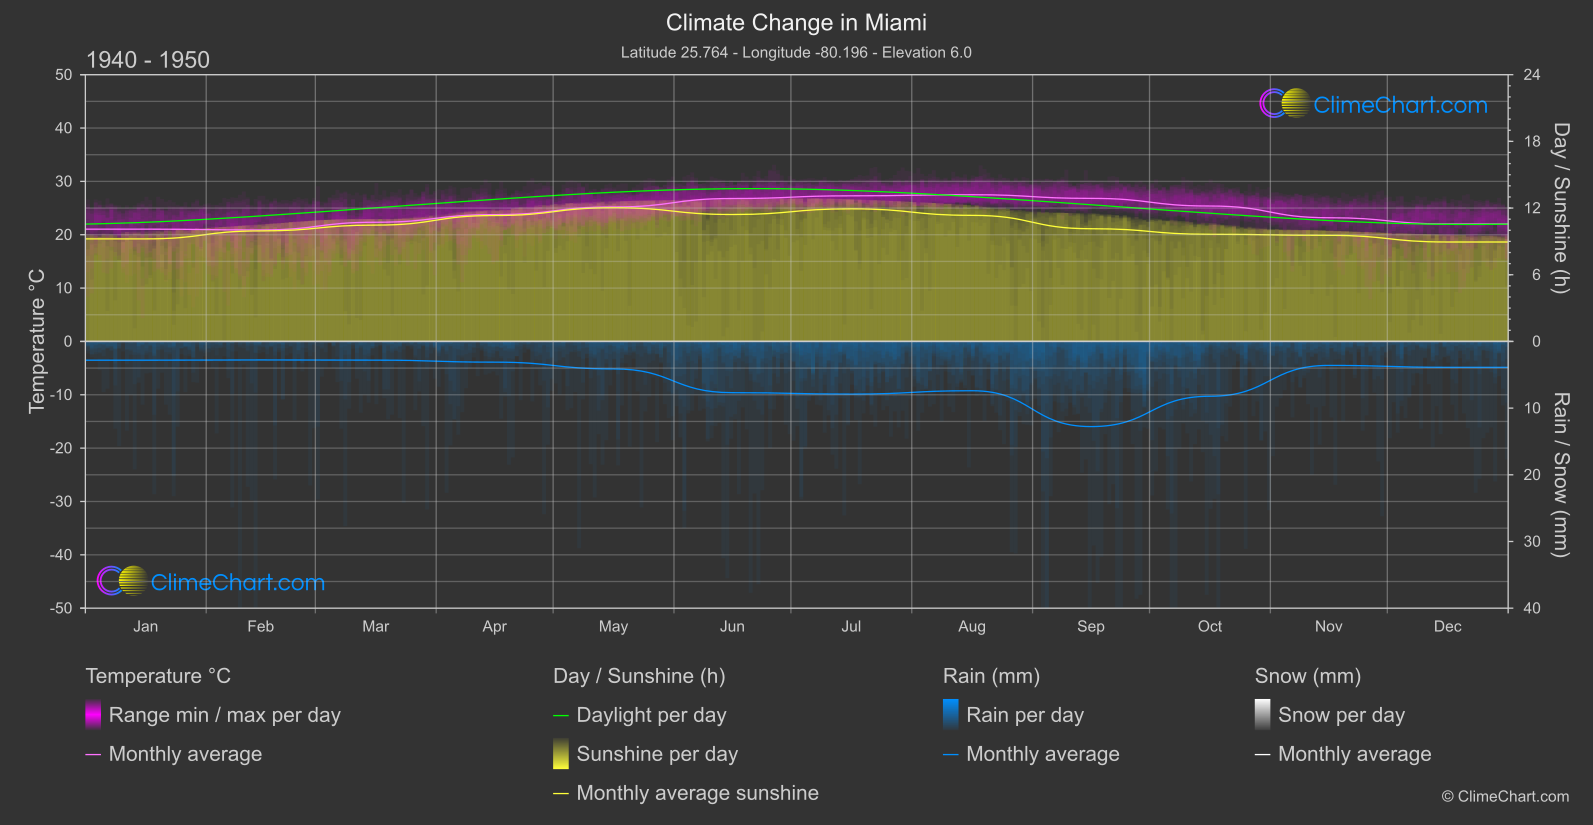
Miami, located in the United States, has been experiencing shifts in temperature, rainfall, and sunshine duration over the years. Analyzing the data from 1940 to 1950 alongside the period from 2013 to 2024, it is evident that some months have shown significant changes. For instance, February experienced a notable increase in temperature, while May saw a substantial rise in rainfall. Understanding these variations is crucial for comprehending the evolving climate in Miami.
Climate Change Data Overview for Miami, USA
Explore the comprehensive climate change data for Miami, USA. This detailed table provides valuable insights into temperature variations, precipitation levels, and seasonal changes influenced by climate change, helping you understand the unique weather patterns of this region.
Temperature °C
| Month | ⌀ 1940 - 1950 | ⌀ 2013 - 2023 | +/- |
|---|---|---|---|
| Jan | 21.04 | 20.72 | -0.33 |
| Feb | 20.90 | 22.12 | 1.22 |
| Mar | 22.34 | 22.76 | 0.42 |
| Apr | 23.77 | 24.65 | 0.89 |
| May | 25.20 | 25.68 | 0.48 |
| Jun | 26.79 | 26.99 | 0.20 |
| Jul | 27.29 | 27.97 | 0.68 |
| Aug | 27.50 | 28.18 | 0.68 |
| Sep | 26.81 | 27.26 | 0.44 |
| Oct | 25.38 | 26.01 | 0.62 |
| Nov | 23.19 | 23.82 | 0.63 |
| Dec | 22.01 | 22.34 | 0.33 |
| ⌀ Month | 24.35 | 24.87 | 0.52 |
Sunshine (h)
| Month | ⌀ 1940 - 1950 | ⌀ 2013 - 2023 | +/- |
|---|---|---|---|
| Jan | 9.23 | 8.54 | -0.69 |
| Feb | 9.94 | 9.75 | -0.19 |
| Mar | 10.47 | 10.39 | -0.07 |
| Apr | 11.33 | 11.18 | -0.15 |
| May | 12.03 | 11.12 | -0.91 |
| Jun | 11.42 | 10.50 | -0.92 |
| Jul | 11.93 | 11.13 | -0.80 |
| Aug | 11.34 | 10.46 | -0.88 |
| Sep | 10.14 | 9.67 | -0.47 |
| Oct | 9.64 | 9.23 | -0.41 |
| Nov | 9.55 | 8.86 | -0.68 |
| Dec | 8.95 | 8.49 | -0.45 |
| ⌀ Month | 10.50 | 9.94 | -0.55 |
Rain (mm)
| Month | ⌀ 1940 - 1950 | ⌀ 2013 - 2023 | +/- |
|---|---|---|---|
| Jan | 1.41 | 2.33 | 0.92 |
| Feb | 1.39 | 2.13 | 0.74 |
| Mar | 1.40 | 1.60 | 0.20 |
| Apr | 1.55 | 2.81 | 1.26 |
| May | 2.06 | 4.78 | 2.72 |
| Jun | 3.84 | 6.49 | 2.65 |
| Jul | 3.95 | 4.68 | 0.74 |
| Aug | 3.70 | 4.64 | 0.94 |
| Sep | 6.38 | 6.45 | 0.07 |
| Oct | 4.11 | 3.98 | -0.13 |
| Nov | 1.80 | 3.51 | 1.71 |
| Dec | 1.94 | 2.58 | 0.64 |
| ⌀ Month | 2.79 | 3.83 | 1.04 |
Snow (mm)
| Month | ⌀ 1940 - 1950 | ⌀ 2013 - 2023 | +/- |
|---|---|---|---|
| Jan | 0.00 | 0.00 | 0.00 |
| Feb | 0.00 | 0.00 | 0.00 |
| Mar | 0.00 | 0.00 | 0.00 |
| Apr | 0.00 | 0.00 | 0.00 |
| May | 0.00 | 0.00 | 0.00 |
| Jun | 0.00 | 0.00 | 0.00 |
| Jul | 0.00 | 0.00 | 0.00 |
| Aug | 0.00 | 0.00 | 0.00 |
| Sep | 0.00 | 0.00 | 0.00 |
| Oct | 0.00 | 0.00 | 0.00 |
| Nov | 0.00 | 0.00 | 0.00 |
| Dec | 0.00 | 0.00 | 0.00 |
| ⌀ Month | 0.00 | 0.00 | 0.00 |