Climate Chart of Maui, USA
Comprehensive Climate Chart of Maui, USA: Monthly Averages and Weather Trends
Explore the tropical paradise of Maui, United States of America, and discover its unique climate and weather patterns.
Maui, located in Hawaii, enjoys a tropical climate with warm temperatures year-round. The island experiences two main seasons: a dry season from April to October, and a wet season from November to March. The average temperature ranges from 75°F to 85°F (24°C to 29°C). Maui's weather can vary significantly across different parts of the island, with coastal areas being warmer than the upland regions.
Best Travel Time Guide for Maui, USA: Ideal Seasons and Weather Insights
The best time to travel to Maui is during the dry season from April to October when the weather is sunny and pleasant. This period offers ideal conditions for outdoor activities such as hiking, snorkeling, and beach bumming. However, travelers should be prepared for occasional showers even during the dry season. The shoulder months of April, May, September, and October are particularly popular for fewer crowds and lower accommodation rates.
Climate Data Overview for Maui, USA
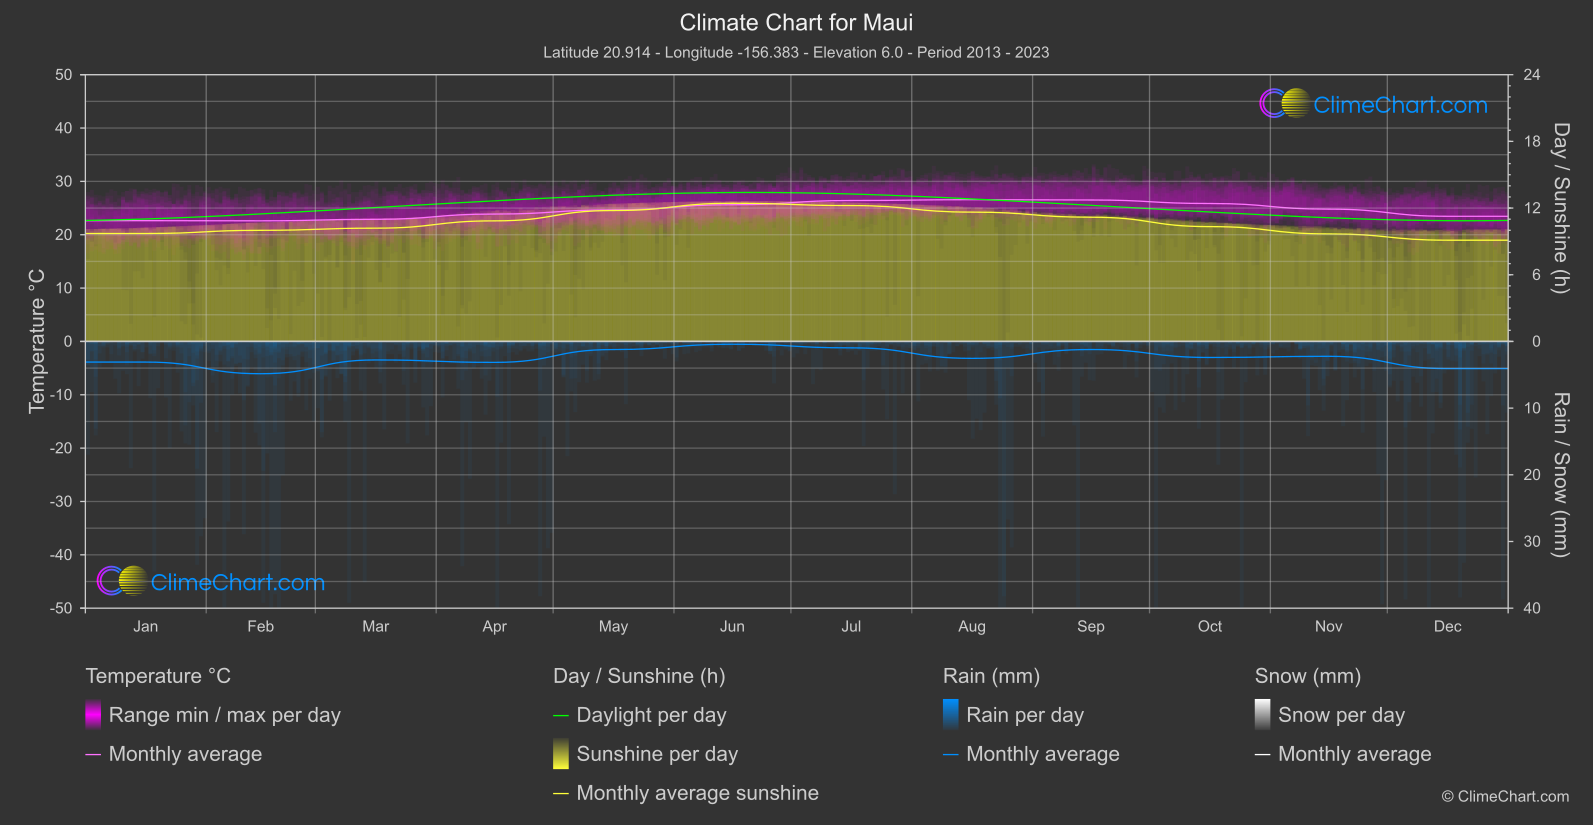
Explore the comprehensive climate data for Maui, USA. This detailed table provides valuable insights into temperature variations, precipitation levels, and seasonal changes, helping you understand the unique weather patterns of this region.
| Month | ⌀ Temperature °C | ⌀ Rain (mm) | ⌀ Snow (mm) | ⌀ Sunshine (h) |
|---|---|---|---|---|
| Jan | 22.6 | 1.55 | 0.00 | 9.71 |
| Feb | 22.6 | 2.42 | 0.00 | 10.00 |
| Mar | 22.9 | 1.39 | 0.00 | 10.19 |
| Apr | 23.9 | 1.57 | 0.00 | 10.85 |
| May | 24.7 | 0.61 | 0.00 | 11.78 |
| Jun | 25.6 | 0.21 | 0.00 | 12.43 |
| Jul | 26.4 | 0.48 | 0.00 | 12.22 |
| Aug | 26.6 | 1.27 | 0.00 | 11.63 |
| Sep | 26.5 | 0.61 | 0.00 | 11.18 |
| Oct | 25.9 | 1.20 | 0.00 | 10.33 |
| Nov | 24.8 | 1.12 | 0.00 | 9.67 |
| Dec | 23.5 | 2.04 | 0.00 | 9.11 |
| ⌀ Month | 24.7 | 1.21 | 0.00 | 10.76 |