Climate Change Chart of Maui, USA
Comprehensive Climate Change Chart of Maui, USA: Monthly Averages and Impact Trends
Exploring the climate changes in Maui, United States of America reveals significant shifts in temperature, rainfall, and sunshine duration over the years. Let's delve into the data to understand how the climate has evolved.
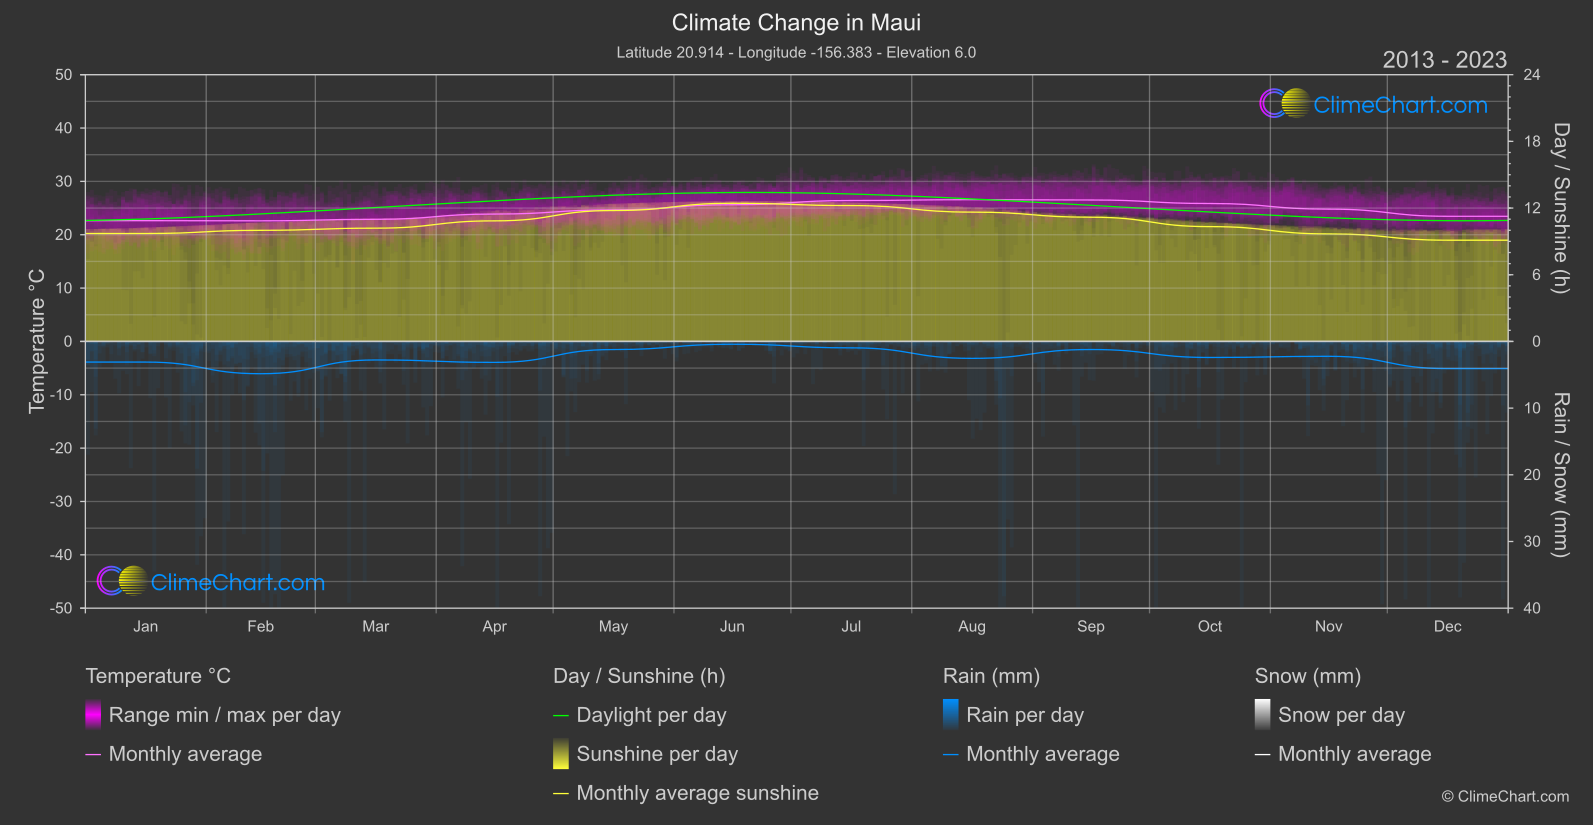
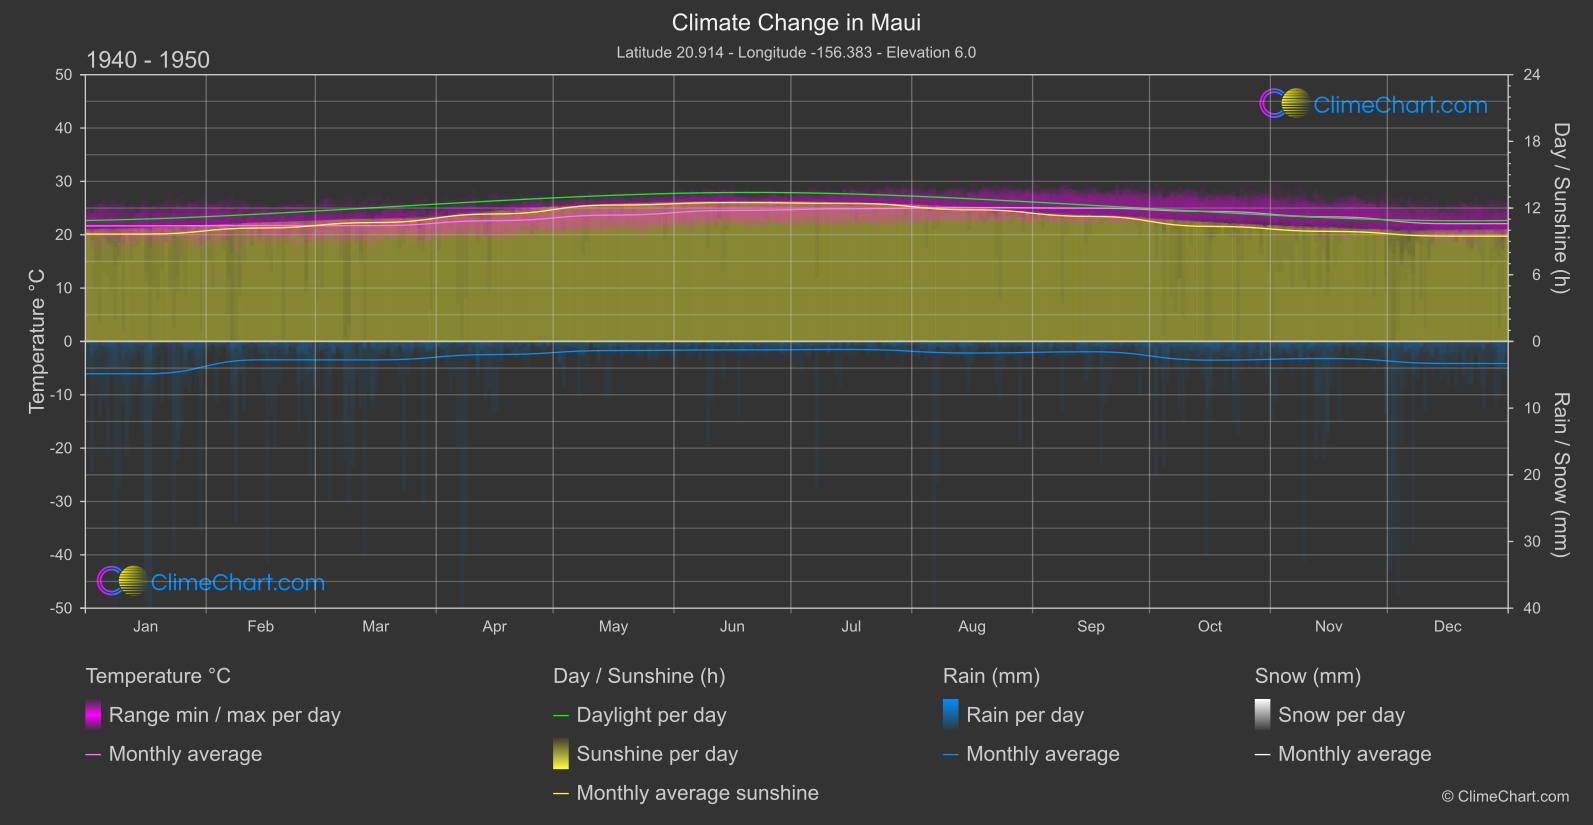
Maui, a popular tourist destination known for its stunning beaches and diverse landscapes, has been experiencing notable climate changes. Analyzing the data from 1940 to 1950 compared to 2013 to 2024 reveals interesting insights. In terms of temperature, the month with the highest change is July, with a significant increase of 1.55°C. On the other hand, the month with the most drastic decrease in rainfall is June, showing a reduction of 0.42 mm. Additionally, the sunshine duration has seen fluctuations, with December experiencing the largest decrease of 0.37 hours.
Climate Change Data Overview for Maui, USA
Explore the comprehensive climate change data for Maui, USA. This detailed table provides valuable insights into temperature variations, precipitation levels, and seasonal changes influenced by climate change, helping you understand the unique weather patterns of this region.
Temperature °C
| Month | ⌀ 1940 - 1950 | ⌀ 2013 - 2023 | +/- |
|---|---|---|---|
| Jan | 21.66 | 22.64 | 0.98 |
| Feb | 21.73 | 22.61 | 0.88 |
| Mar | 21.70 | 22.89 | 1.19 |
| Apr | 22.63 | 23.88 | 1.24 |
| May | 23.68 | 24.66 | 0.97 |
| Jun | 24.55 | 25.62 | 1.07 |
| Jul | 24.87 | 26.41 | 1.55 |
| Aug | 25.10 | 26.57 | 1.47 |
| Sep | 24.98 | 26.51 | 1.53 |
| Oct | 24.38 | 25.85 | 1.47 |
| Nov | 23.36 | 24.80 | 1.44 |
| Dec | 22.07 | 23.46 | 1.38 |
| ⌀ Month | 23.39 | 24.66 | 1.26 |
Sunshine (h)
| Month | ⌀ 1940 - 1950 | ⌀ 2013 - 2023 | +/- |
|---|---|---|---|
| Jan | 9.66 | 9.71 | 0.05 |
| Feb | 10.20 | 10.00 | -0.21 |
| Mar | 10.70 | 10.19 | -0.51 |
| Apr | 11.47 | 10.85 | -0.62 |
| May | 12.27 | 11.78 | -0.49 |
| Jun | 12.50 | 12.43 | -0.06 |
| Jul | 12.42 | 12.22 | -0.19 |
| Aug | 11.84 | 11.63 | -0.21 |
| Sep | 11.25 | 11.18 | -0.07 |
| Oct | 10.35 | 10.33 | -0.02 |
| Nov | 9.90 | 9.67 | -0.23 |
| Dec | 9.48 | 9.11 | -0.37 |
| ⌀ Month | 11.00 | 10.76 | -0.24 |
Rain (mm)
| Month | ⌀ 1940 - 1950 | ⌀ 2013 - 2023 | +/- |
|---|---|---|---|
| Jan | 2.43 | 1.55 | -0.88 |
| Feb | 1.38 | 2.42 | 1.04 |
| Mar | 1.39 | 1.39 | 0.00 |
| Apr | 0.98 | 1.57 | 0.59 |
| May | 0.68 | 0.61 | -0.07 |
| Jun | 0.63 | 0.21 | -0.42 |
| Jul | 0.60 | 0.48 | -0.12 |
| Aug | 0.87 | 1.27 | 0.40 |
| Sep | 0.77 | 0.61 | -0.17 |
| Oct | 1.40 | 1.20 | -0.20 |
| Nov | 1.28 | 1.12 | -0.17 |
| Dec | 1.65 | 2.04 | 0.38 |
| ⌀ Month | 1.17 | 1.21 | 0.03 |
Snow (mm)
| Month | ⌀ 1940 - 1950 | ⌀ 2013 - 2023 | +/- |
|---|---|---|---|
| Jan | 0.00 | 0.00 | 0.00 |
| Feb | 0.00 | 0.00 | 0.00 |
| Mar | 0.00 | 0.00 | 0.00 |
| Apr | 0.00 | 0.00 | 0.00 |
| May | 0.00 | 0.00 | 0.00 |
| Jun | 0.00 | 0.00 | 0.00 |
| Jul | 0.00 | 0.00 | 0.00 |
| Aug | 0.00 | 0.00 | 0.00 |
| Sep | 0.00 | 0.00 | 0.00 |
| Oct | 0.00 | 0.00 | 0.00 |
| Nov | 0.00 | 0.00 | 0.00 |
| Dec | 0.00 | 0.00 | 0.00 |
| ⌀ Month | 0.00 | 0.00 | 0.00 |