Climate Chart of Marshall Islands, USA
Comprehensive Climate Chart of Marshall Islands, USA: Monthly Averages and Weather Trends
Welcome to the Marshall Islands, a beautiful tropical destination in the United States of America.
The Marshall Islands, located in the Pacific Ocean, have a tropical climate with warm temperatures year-round. The weather is generally hot and humid, with a rainy season from May to November. The islands can experience occasional typhoons during the wet season. The dry season from December to April offers sunny days and pleasant sea breezes.
Best Travel Time Guide for Marshall Islands, USA: Ideal Seasons and Weather Insights
The best time to travel to the Marshall Islands is during the dry season from December to April when you can enjoy sunny days and ideal beach weather. It is advisable to avoid the rainy season from May to November due to the higher chance of typhoons and heavy rainfall.
Climate Data Overview for Marshall Islands, USA
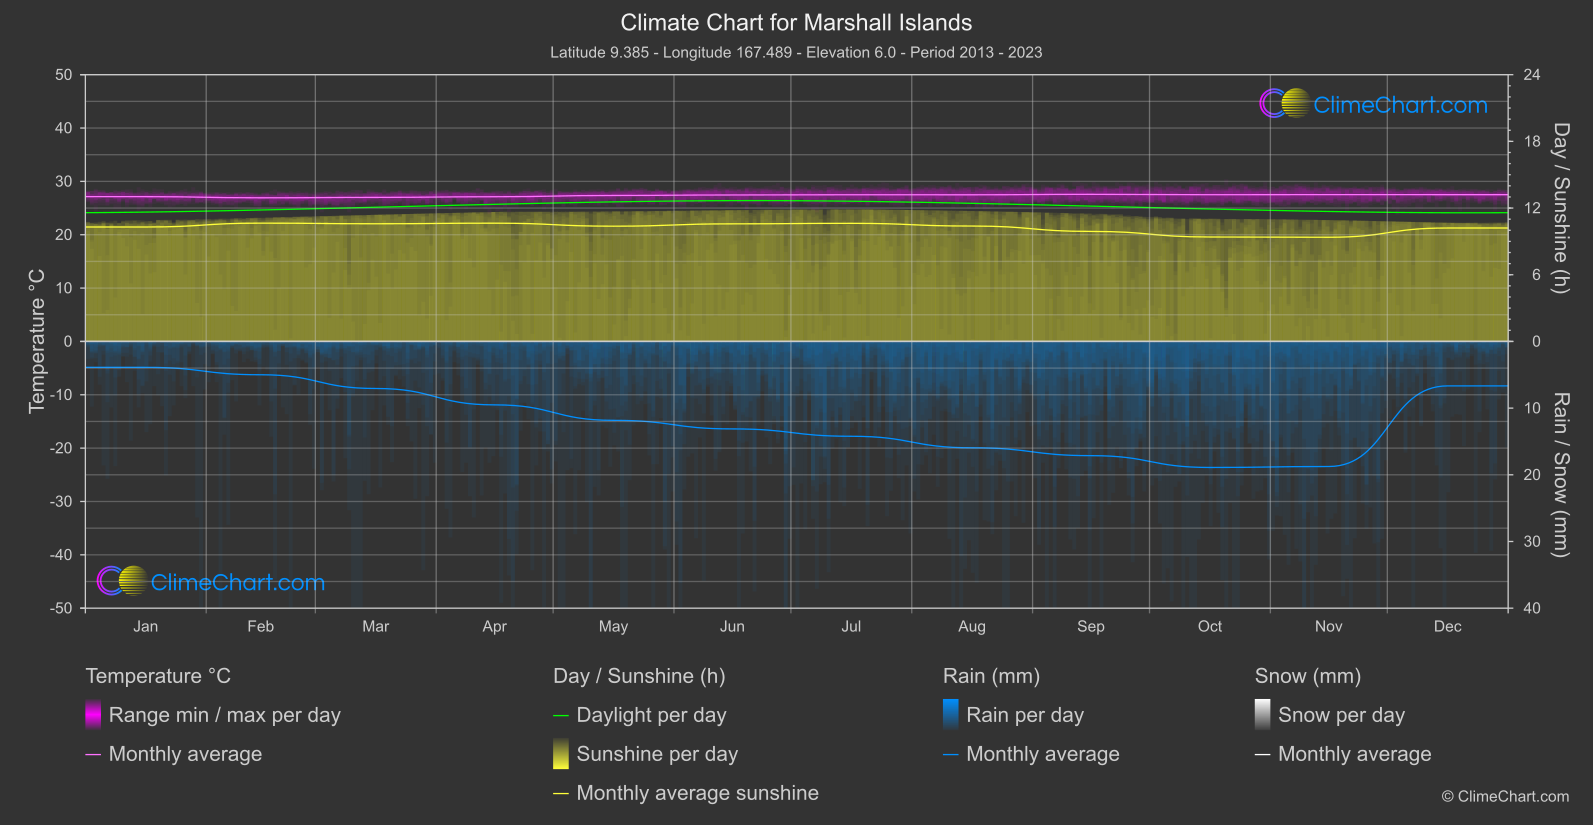
Explore the comprehensive climate data for Marshall Islands, USA. This detailed table provides valuable insights into temperature variations, precipitation levels, and seasonal changes, helping you understand the unique weather patterns of this region.
| Month | ⌀ Temperature °C | ⌀ Rain (mm) | ⌀ Snow (mm) | ⌀ Sunshine (h) |
|---|---|---|---|---|
| Jan | 27.1 | 1.94 | 0.00 | 10.30 |
| Feb | 26.9 | 2.50 | 0.00 | 10.64 |
| Mar | 27.0 | 3.53 | 0.00 | 10.59 |
| Apr | 27.1 | 4.76 | 0.00 | 10.64 |
| May | 27.4 | 5.92 | 0.00 | 10.37 |
| Jun | 27.5 | 6.56 | 0.00 | 10.58 |
| Jul | 27.5 | 7.11 | 0.00 | 10.63 |
| Aug | 27.5 | 7.98 | 0.00 | 10.38 |
| Sep | 27.6 | 8.56 | 0.00 | 9.90 |
| Oct | 27.5 | 9.45 | 0.00 | 9.40 |
| Nov | 27.5 | 9.38 | 0.00 | 9.37 |
| Dec | 27.5 | 3.33 | 0.00 | 10.21 |
| ⌀ Month | 27.3 | 5.92 | 0.00 | 10.25 |