Climate Change Chart of Marshall Islands, USA
Comprehensive Climate Change Chart of Marshall Islands, USA: Monthly Averages and Impact Trends
Exploring the climate change data in Marshall Islands, United States of America reveals significant shifts in temperature, rainfall, and sunshine duration over the years.
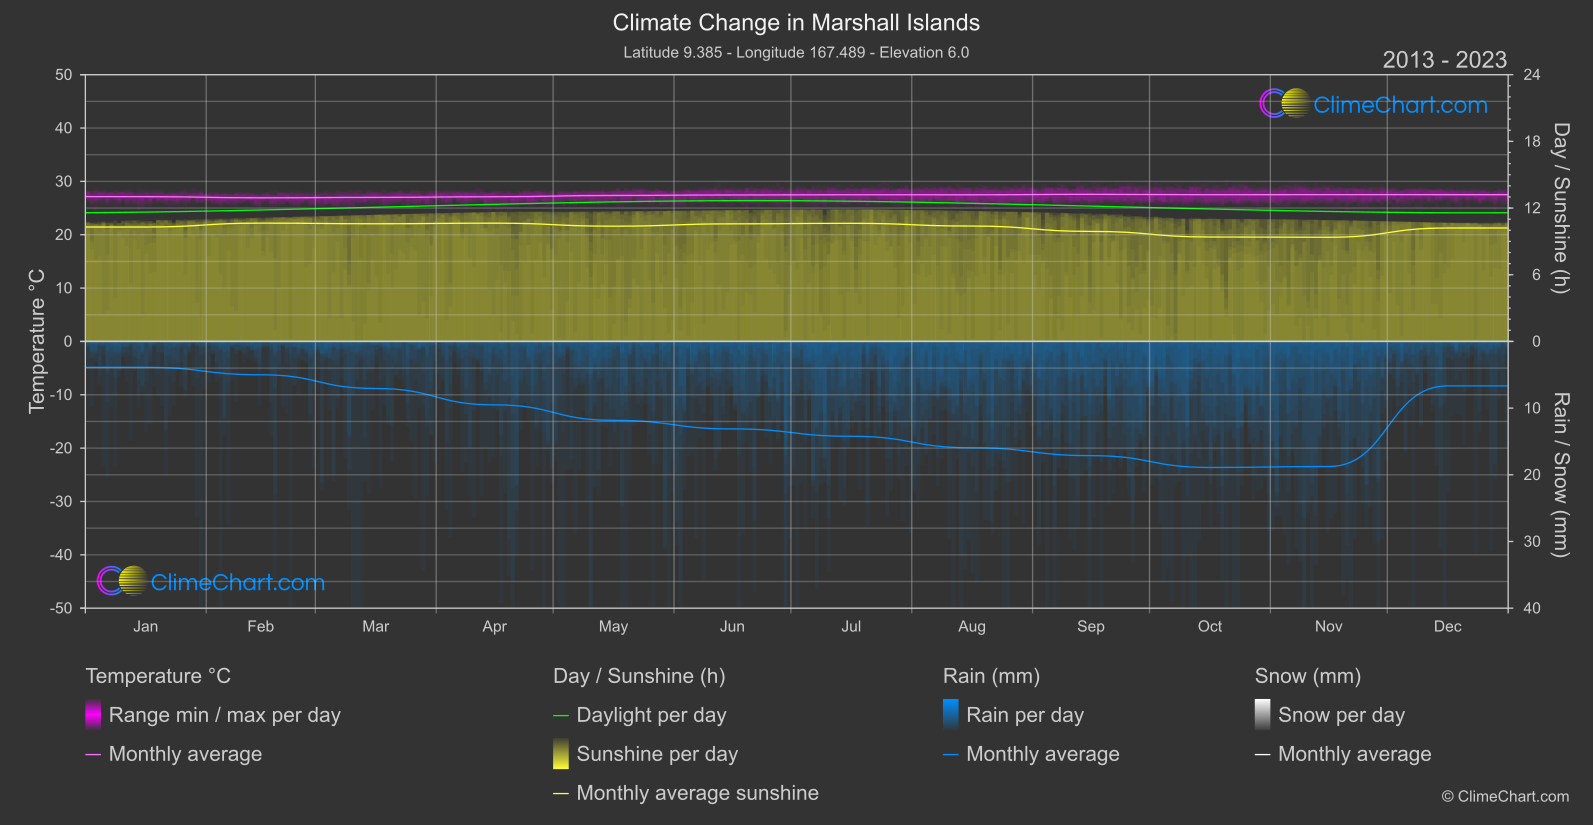
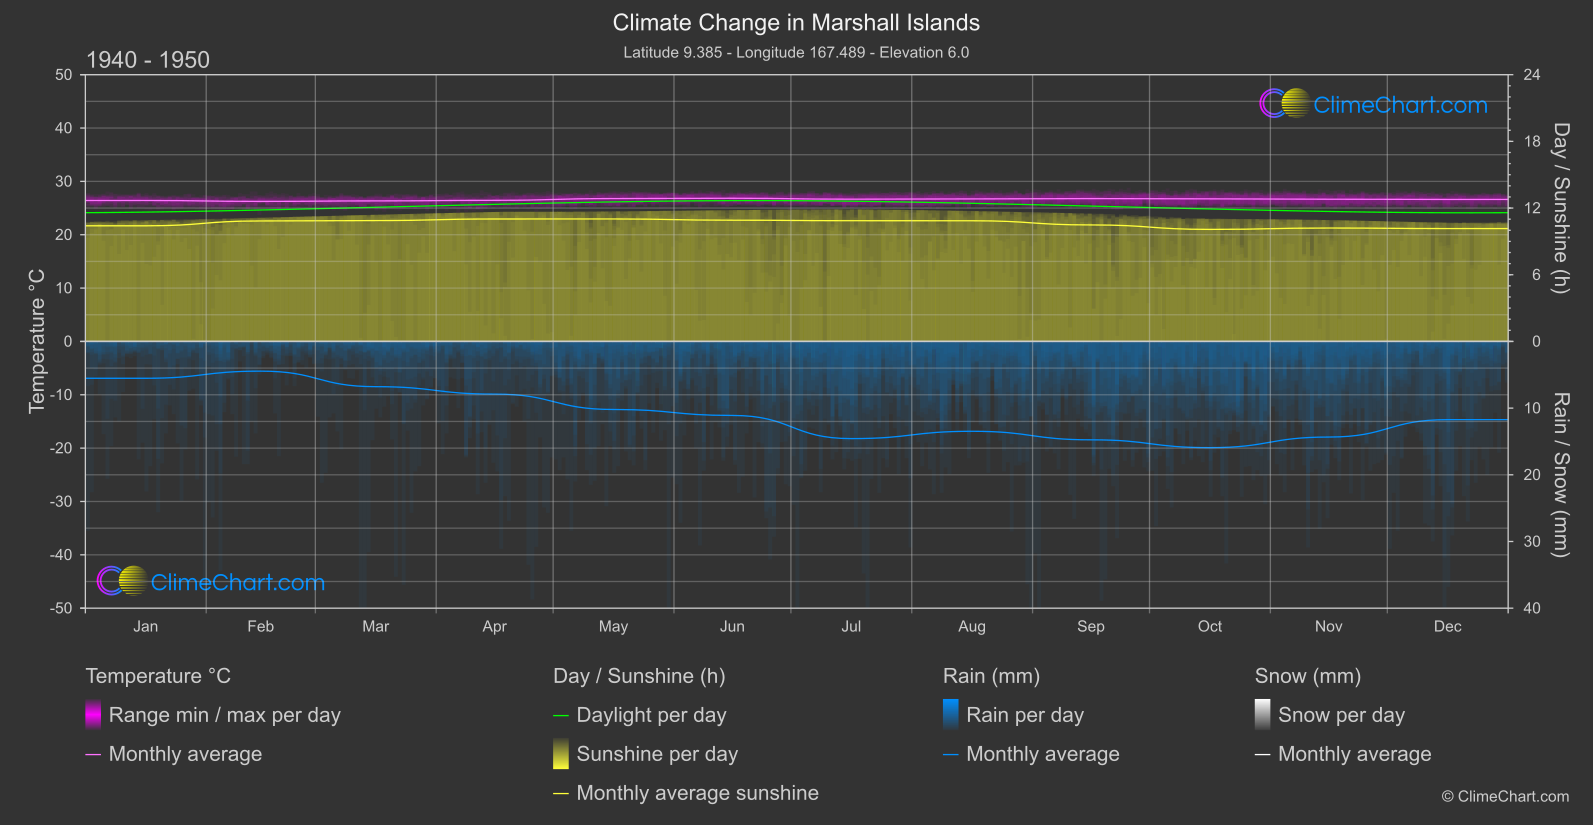
In Marshall Islands, the data reflects a consistent increase in temperature over the years, with July and December experiencing the highest temperature changes. Rainfall patterns have also shifted, with notable increases in October and November compared to the past. Moreover, the sunshine duration has shown a decreasing trend, with May and October having the most significant reductions.
Climate Change Data Overview for Marshall Islands, USA
Explore the comprehensive climate change data for Marshall Islands, USA. This detailed table provides valuable insights into temperature variations, precipitation levels, and seasonal changes influenced by climate change, helping you understand the unique weather patterns of this region.
Temperature °C
| Month | ⌀ 1940 - 1950 | ⌀ 2013 - 2023 | +/- |
|---|---|---|---|
| Jan | 26.42 | 27.14 | 0.72 |
| Feb | 26.25 | 26.92 | 0.68 |
| Mar | 26.34 | 27.00 | 0.66 |
| Apr | 26.45 | 27.12 | 0.68 |
| May | 26.78 | 27.36 | 0.58 |
| Jun | 26.84 | 27.45 | 0.62 |
| Jul | 26.66 | 27.49 | 0.83 |
| Aug | 26.71 | 27.49 | 0.77 |
| Sep | 26.78 | 27.57 | 0.80 |
| Oct | 26.73 | 27.50 | 0.78 |
| Nov | 26.66 | 27.52 | 0.86 |
| Dec | 26.62 | 27.51 | 0.90 |
| ⌀ Month | 26.60 | 27.34 | 0.74 |
Sunshine (h)
| Month | ⌀ 1940 - 1950 | ⌀ 2013 - 2023 | +/- |
|---|---|---|---|
| Jan | 10.40 | 10.30 | -0.11 |
| Feb | 10.84 | 10.64 | -0.20 |
| Mar | 10.87 | 10.59 | -0.29 |
| Apr | 11.02 | 10.64 | -0.38 |
| May | 11.02 | 10.37 | -0.65 |
| Jun | 10.91 | 10.58 | -0.33 |
| Jul | 10.86 | 10.63 | -0.24 |
| Aug | 10.86 | 10.38 | -0.47 |
| Sep | 10.48 | 9.90 | -0.58 |
| Oct | 10.08 | 9.40 | -0.68 |
| Nov | 10.20 | 9.37 | -0.83 |
| Dec | 10.15 | 10.21 | 0.05 |
| ⌀ Month | 10.64 | 10.25 | -0.39 |
Rain (mm)
| Month | ⌀ 1940 - 1950 | ⌀ 2013 - 2023 | +/- |
|---|---|---|---|
| Jan | 2.76 | 1.94 | -0.82 |
| Feb | 2.23 | 2.50 | 0.27 |
| Mar | 3.39 | 3.53 | 0.14 |
| Apr | 3.95 | 4.76 | 0.81 |
| May | 5.10 | 5.92 | 0.81 |
| Jun | 5.55 | 6.56 | 1.01 |
| Jul | 7.29 | 7.11 | -0.18 |
| Aug | 6.74 | 7.98 | 1.24 |
| Sep | 7.38 | 8.56 | 1.19 |
| Oct | 7.96 | 9.45 | 1.49 |
| Nov | 7.17 | 9.38 | 2.21 |
| Dec | 5.86 | 3.33 | -2.53 |
| ⌀ Month | 5.45 | 5.92 | 0.47 |
Snow (mm)
| Month | ⌀ 1940 - 1950 | ⌀ 2013 - 2023 | +/- |
|---|---|---|---|
| Jan | 0.00 | 0.00 | 0.00 |
| Feb | 0.00 | 0.00 | 0.00 |
| Mar | 0.00 | 0.00 | 0.00 |
| Apr | 0.00 | 0.00 | 0.00 |
| May | 0.00 | 0.00 | 0.00 |
| Jun | 0.00 | 0.00 | 0.00 |
| Jul | 0.00 | 0.00 | 0.00 |
| Aug | 0.00 | 0.00 | 0.00 |
| Sep | 0.00 | 0.00 | 0.00 |
| Oct | 0.00 | 0.00 | 0.00 |
| Nov | 0.00 | 0.00 | 0.00 |
| Dec | 0.00 | 0.00 | 0.00 |
| ⌀ Month | 0.00 | 0.00 | 0.00 |