Climate Chart of Managua, Nicaragua
Comprehensive Climate Chart of Managua, Nicaragua: Monthly Averages and Weather Trends
Discover the Climate in Managua, Nicaragua
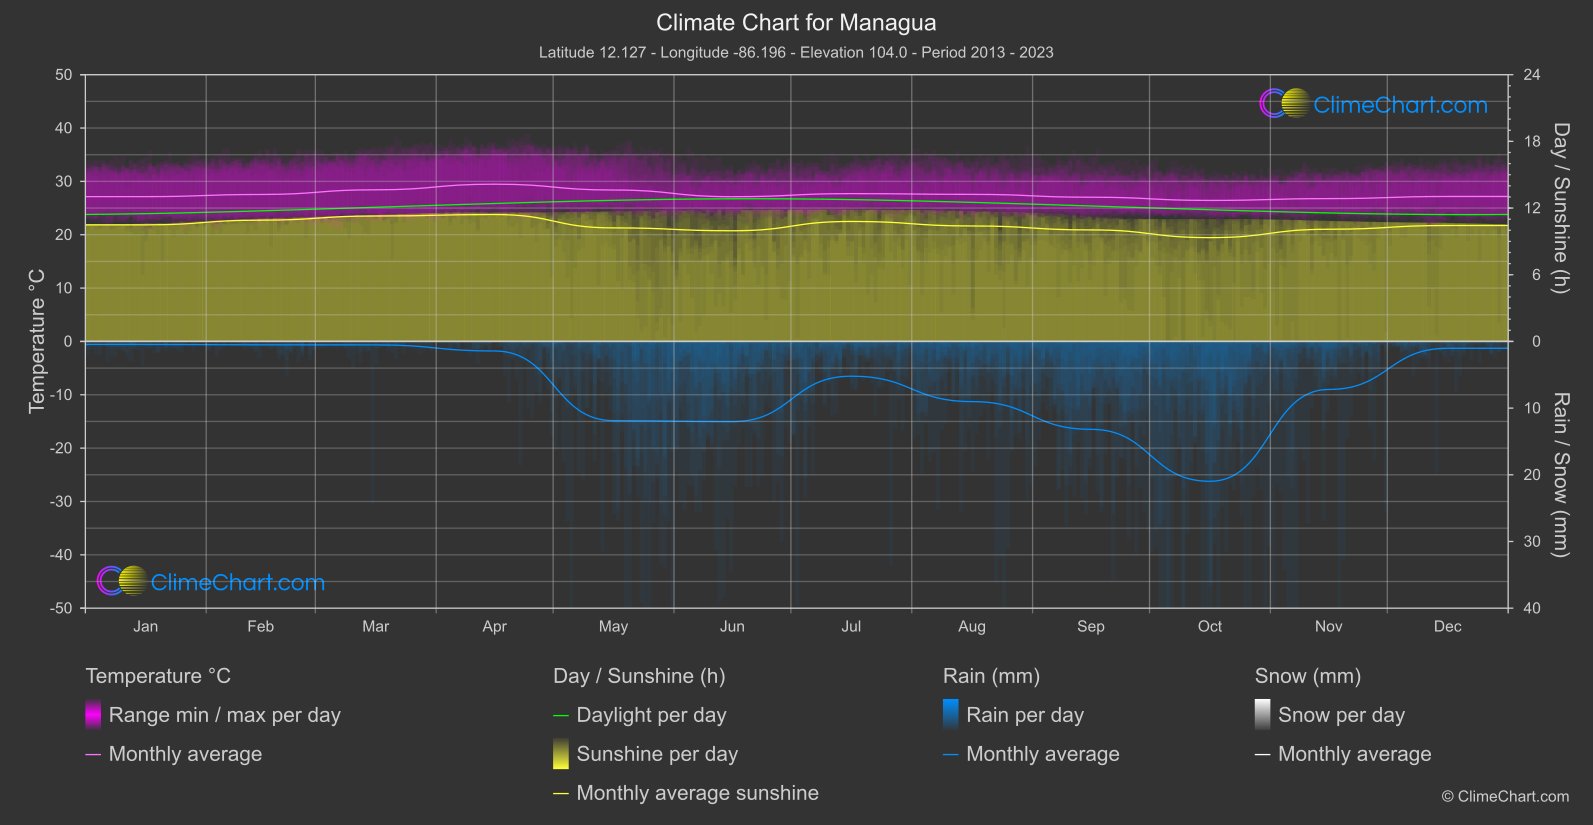
Managua, the capital of Nicaragua, has a tropical climate with distinct wet and dry seasons. The average annual temperature is around 27°C (80°F). The rainy season typically lasts from May to October, with the heaviest rainfall occurring in September and October. The dry season runs from November to April, with December and January being the coolest months. Visitors should be prepared for high humidity levels throughout the year. Overall, Managua enjoys warm temperatures and plenty of sunshine, making it an ideal destination for those seeking a tropical climate.
Best Travel Time Guide for Managua, Nicaragua: Ideal Seasons and Weather Insights
The best time to visit Managua is during the dry season from November to April when the weather is sunny and pleasant. This period offers ideal conditions for exploring the city and its surroundings. If you prefer to avoid the rainy season, plan your trip between November and April to make the most of your visit to Managua.
Climate Data Overview for Managua, Nicaragua
Explore the comprehensive climate data for Managua, Nicaragua. This detailed table provides valuable insights into temperature variations, precipitation levels, and seasonal changes, helping you understand the unique weather patterns of this region.
| Month | ⌀ Temperature °C | ⌀ Rain (mm) | ⌀ Snow (mm) | ⌀ Sunshine (h) |
|---|---|---|---|---|
| Jan | 27.1 | 0.23 | 0.00 | 10.49 |
| Feb | 27.5 | 0.25 | 0.00 | 10.91 |
| Mar | 28.4 | 0.26 | 0.00 | 11.28 |
| Apr | 29.5 | 0.72 | 0.00 | 11.42 |
| May | 28.4 | 5.94 | 0.00 | 10.22 |
| Jun | 27.1 | 6.01 | 0.00 | 9.96 |
| Jul | 27.7 | 2.61 | 0.00 | 10.80 |
| Aug | 27.6 | 4.51 | 0.00 | 10.39 |
| Sep | 27.0 | 6.59 | 0.00 | 10.03 |
| Oct | 26.4 | 10.49 | 0.00 | 9.34 |
| Nov | 26.8 | 3.60 | 0.00 | 10.09 |
| Dec | 27.2 | 0.51 | 0.00 | 10.43 |
| ⌀ Month | 27.6 | 3.48 | 0.00 | 10.45 |