Climate Change Chart of Managua, Nicaragua
Comprehensive Climate Change Chart of Managua, Nicaragua: Monthly Averages and Impact Trends
Exploring the climate change data for Managua, Nicaragua reveals intriguing insights into the temperature, rainfall, and sunshine duration trends over the years.
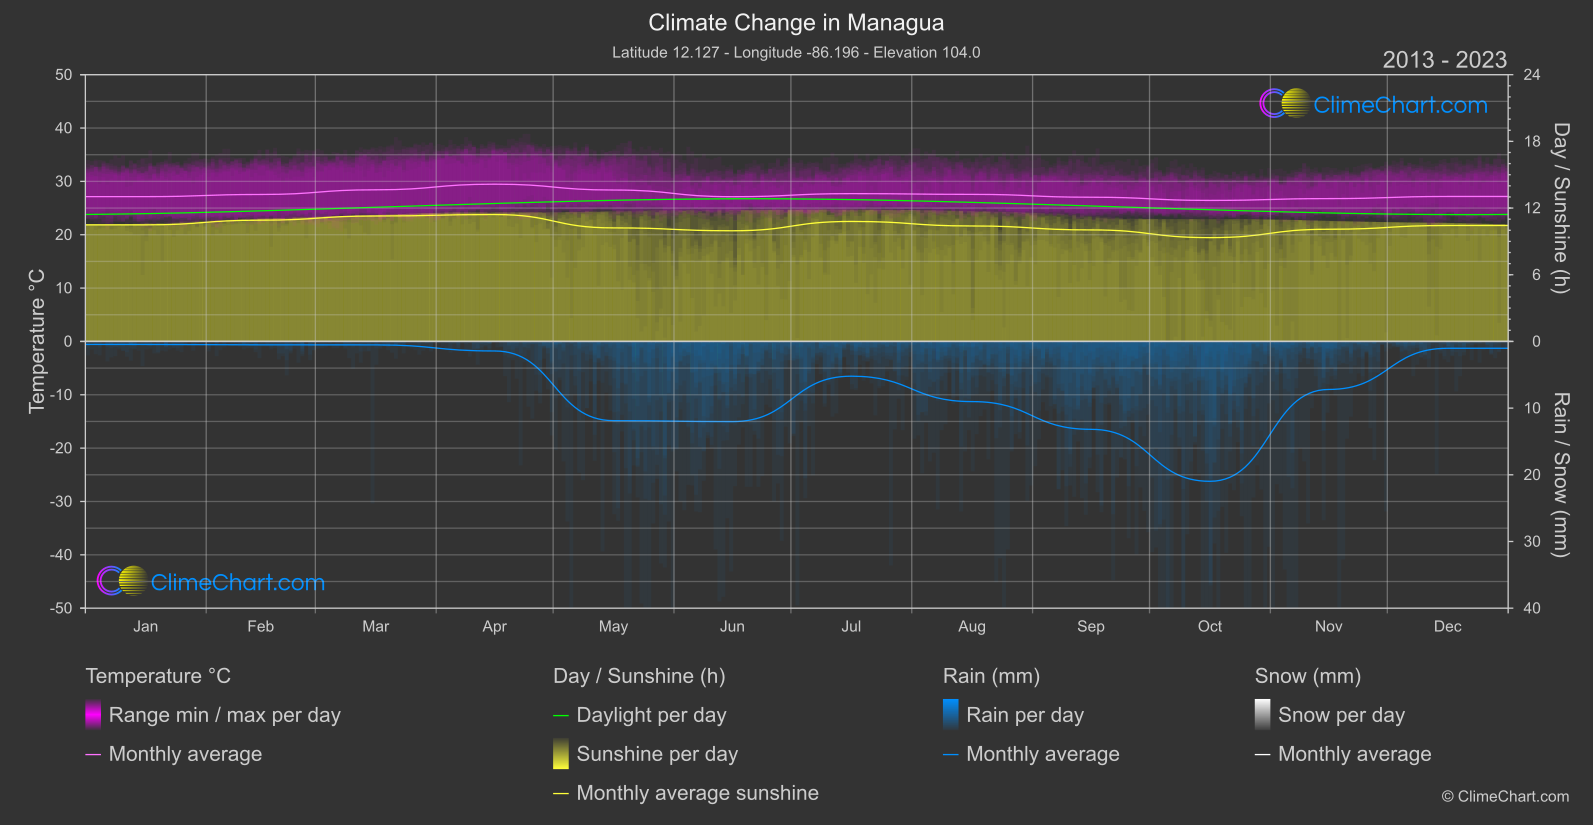
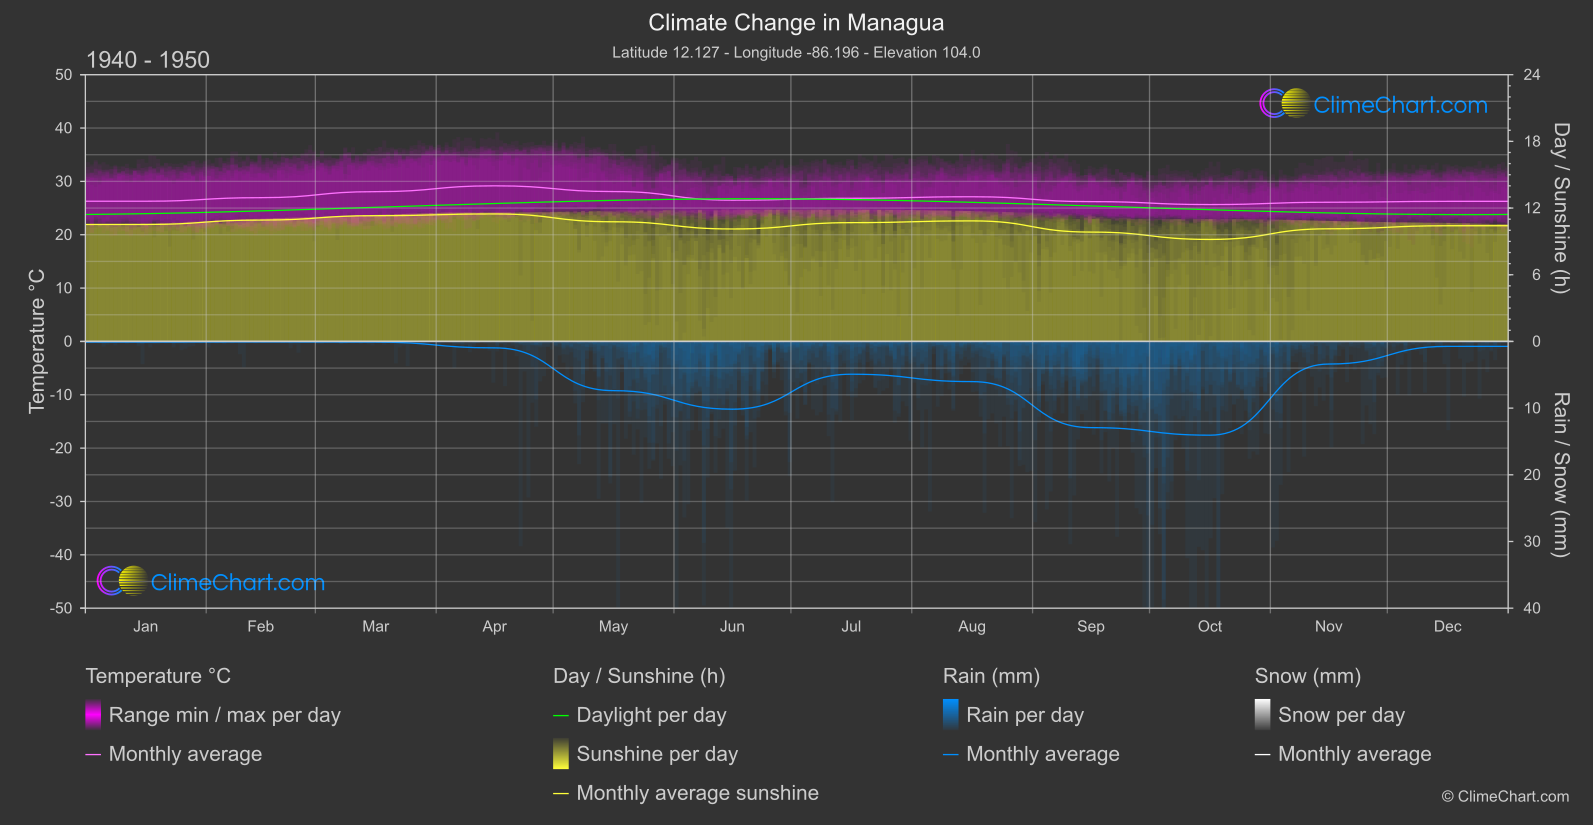
Managua, the capital city of Nicaragua, experiences significant changes in climate patterns. The temperature has generally increased over the years, with noticeable rises particularly in January, July, and December. Rainfall has also shown variations, with substantial increases in precipitation observed in May, October, and November. Sunshine duration has fluctuated, with some months experiencing a decrease in sunlight hours compared to the past. These shifts in climate metrics highlight the ongoing impact of climate change on Managua's weather.
Climate Change Data Overview for Managua, Nicaragua
Explore the comprehensive climate change data for Managua, Nicaragua. This detailed table provides valuable insights into temperature variations, precipitation levels, and seasonal changes influenced by climate change, helping you understand the unique weather patterns of this region.
Temperature °C
| Month | ⌀ 1940 - 1950 | ⌀ 2013 - 2023 | +/- |
|---|---|---|---|
| Jan | 26.28 | 27.14 | 0.86 |
| Feb | 26.95 | 27.55 | 0.60 |
| Mar | 28.08 | 28.42 | 0.35 |
| Apr | 29.17 | 29.48 | 0.31 |
| May | 28.09 | 28.38 | 0.29 |
| Jun | 26.47 | 27.13 | 0.66 |
| Jul | 26.83 | 27.70 | 0.87 |
| Aug | 27.12 | 27.57 | 0.45 |
| Sep | 26.21 | 27.03 | 0.82 |
| Oct | 25.66 | 26.43 | 0.78 |
| Nov | 26.09 | 26.77 | 0.68 |
| Dec | 26.26 | 27.17 | 0.91 |
| ⌀ Month | 26.93 | 27.56 | 0.63 |
Sunshine (h)
| Month | ⌀ 1940 - 1950 | ⌀ 2013 - 2023 | +/- |
|---|---|---|---|
| Jan | 10.52 | 10.49 | -0.04 |
| Feb | 10.92 | 10.91 | -0.01 |
| Mar | 11.31 | 11.28 | -0.03 |
| Apr | 11.47 | 11.42 | -0.05 |
| May | 10.77 | 10.22 | -0.55 |
| Jun | 10.12 | 9.96 | -0.16 |
| Jul | 10.69 | 10.80 | 0.11 |
| Aug | 10.85 | 10.39 | -0.46 |
| Sep | 9.84 | 10.03 | 0.19 |
| Oct | 9.18 | 9.34 | 0.16 |
| Nov | 10.13 | 10.09 | -0.04 |
| Dec | 10.41 | 10.43 | 0.02 |
| ⌀ Month | 10.52 | 10.45 | -0.07 |
Rain (mm)
| Month | ⌀ 1940 - 1950 | ⌀ 2013 - 2023 | +/- |
|---|---|---|---|
| Jan | 0.05 | 0.23 | 0.17 |
| Feb | 0.04 | 0.25 | 0.22 |
| Mar | 0.05 | 0.26 | 0.21 |
| Apr | 0.48 | 0.72 | 0.23 |
| May | 3.69 | 5.94 | 2.25 |
| Jun | 5.08 | 6.01 | 0.93 |
| Jul | 2.46 | 2.61 | 0.15 |
| Aug | 3.01 | 4.51 | 1.50 |
| Sep | 6.46 | 6.59 | 0.13 |
| Oct | 7.03 | 10.49 | 3.46 |
| Nov | 1.70 | 3.60 | 1.90 |
| Dec | 0.37 | 0.51 | 0.14 |
| ⌀ Month | 2.53 | 3.48 | 0.94 |
Snow (mm)
| Month | ⌀ 1940 - 1950 | ⌀ 2013 - 2023 | +/- |
|---|---|---|---|
| Jan | 0.00 | 0.00 | 0.00 |
| Feb | 0.00 | 0.00 | 0.00 |
| Mar | 0.00 | 0.00 | 0.00 |
| Apr | 0.00 | 0.00 | 0.00 |
| May | 0.00 | 0.00 | 0.00 |
| Jun | 0.00 | 0.00 | 0.00 |
| Jul | 0.00 | 0.00 | 0.00 |
| Aug | 0.00 | 0.00 | 0.00 |
| Sep | 0.00 | 0.00 | 0.00 |
| Oct | 0.00 | 0.00 | 0.00 |
| Nov | 0.00 | 0.00 | 0.00 |
| Dec | 0.00 | 0.00 | 0.00 |
| ⌀ Month | 0.00 | 0.00 | 0.00 |