Climate Chart of Los Cabos, Mexico
Comprehensive Climate Chart of Los Cabos, Mexico: Monthly Averages and Weather Trends
Discover the breathtaking climate of Los Cabos, Mexico.
Los Cabos, located at the southern tip of Mexico's Baja California Peninsula, boasts a desert climate with warm, sunny weather year-round. Summers are hot and dry, with temperatures reaching up to 95°F (35°C), while winters are mild and pleasant, averaging around 77°F (25°C). The region experiences very little rainfall, making it a perfect destination for beach lovers and outdoor enthusiasts.
Best Travel Time Guide for Los Cabos, Mexico: Ideal Seasons and Weather Insights
The best time to travel to Los Cabos is during the winter months from November to April when the weather is mild and pleasant. This period offers ideal conditions for outdoor activities and beach relaxation. Avoid visiting during the summer months if you are not a fan of hot weather.
Climate Data Overview for Los Cabos, Mexico
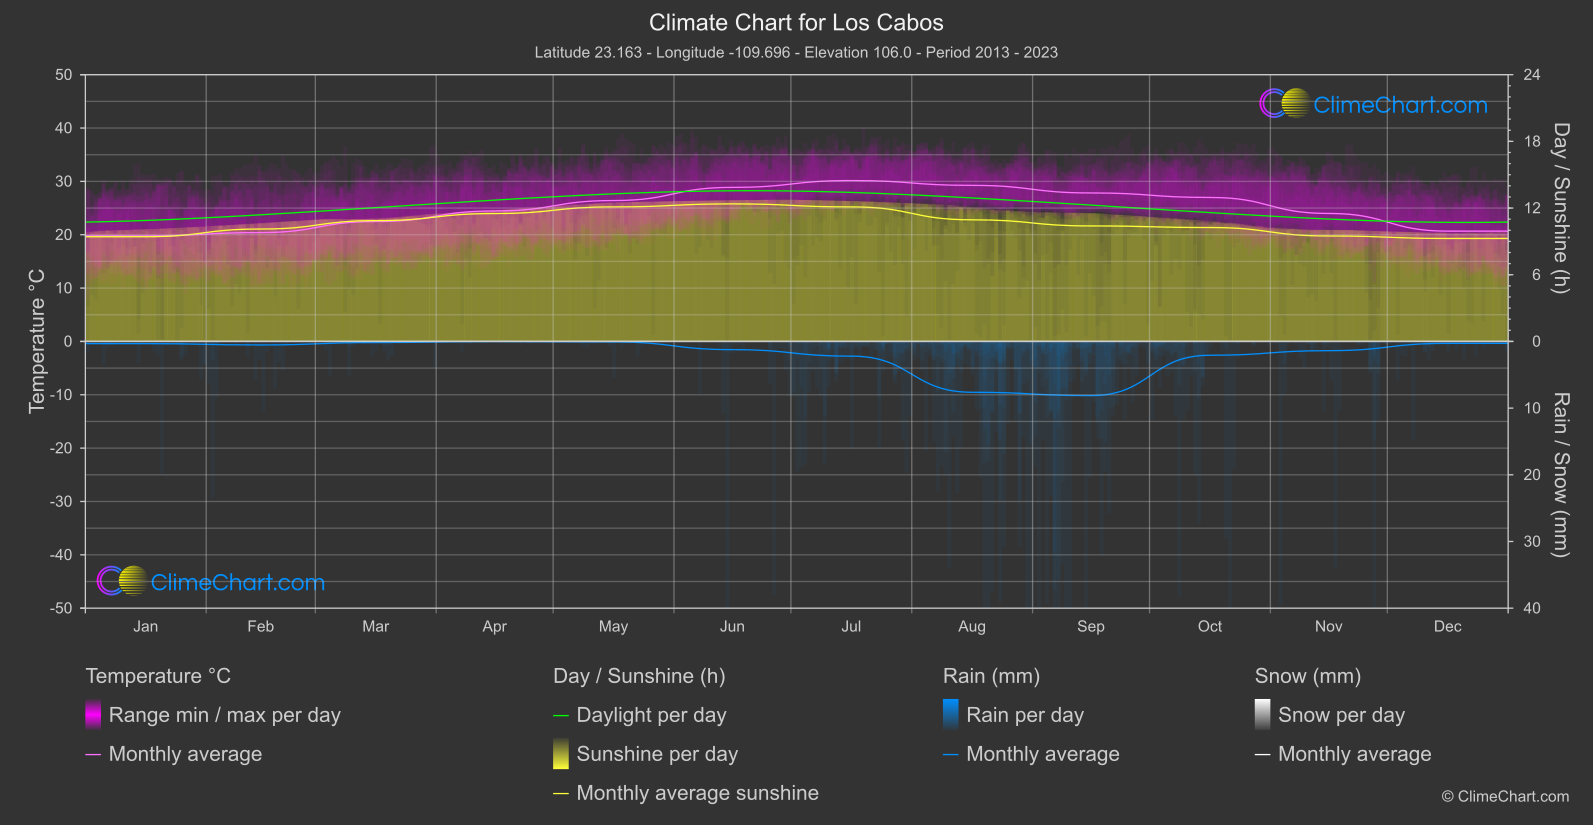
Explore the comprehensive climate data for Los Cabos, Mexico. This detailed table provides valuable insights into temperature variations, precipitation levels, and seasonal changes, helping you understand the unique weather patterns of this region.
| Month | ⌀ Temperature °C | ⌀ Rain (mm) | ⌀ Snow (mm) | ⌀ Sunshine (h) |
|---|---|---|---|---|
| Jan | 19.8 | 0.16 | 0.00 | 9.42 |
| Feb | 20.4 | 0.26 | 0.00 | 10.11 |
| Mar | 22.5 | 0.08 | 0.00 | 10.87 |
| Apr | 24.5 | 0.01 | 0.00 | 11.51 |
| May | 26.4 | 0.04 | 0.00 | 12.10 |
| Jun | 28.9 | 0.61 | 0.00 | 12.37 |
| Jul | 30.2 | 1.10 | 0.00 | 12.10 |
| Aug | 29.3 | 3.81 | 0.00 | 10.94 |
| Sep | 27.8 | 4.06 | 0.00 | 10.39 |
| Oct | 27.0 | 1.04 | 0.00 | 10.25 |
| Nov | 24.0 | 0.69 | 0.00 | 9.49 |
| Dec | 20.7 | 0.14 | 0.00 | 9.26 |
| ⌀ Month | 25.1 | 1.00 | 0.00 | 10.73 |