Climate Change Chart of Los Cabos, Mexico
Comprehensive Climate Change Chart of Los Cabos, Mexico: Monthly Averages and Impact Trends
Explore the changing climate in Los Cabos, Mexico, through insightful data analysis. Discover how temperature, rainfall, and sunshine duration have evolved over the years.
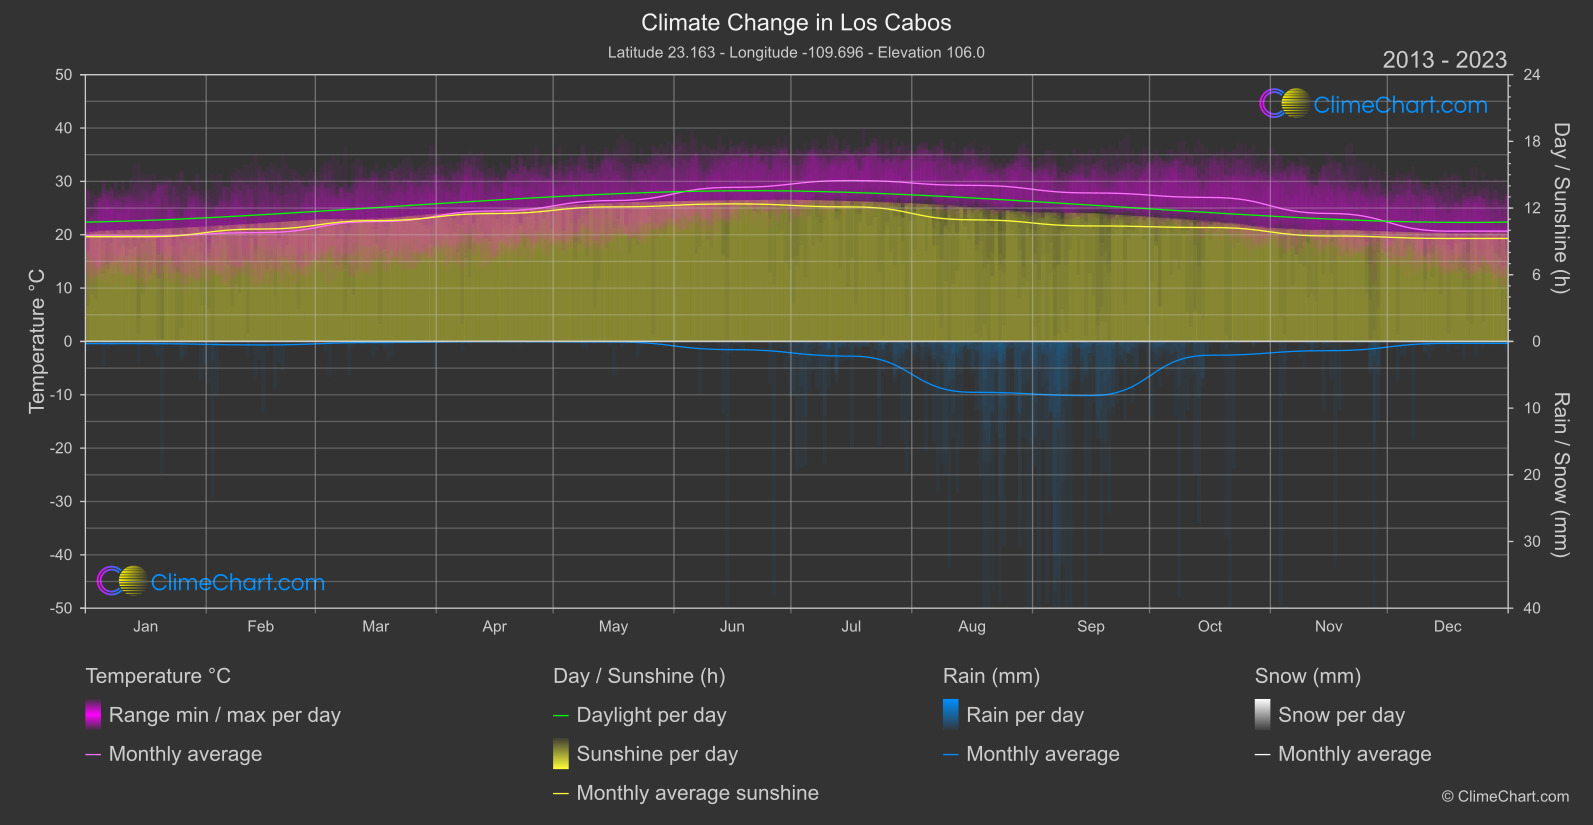
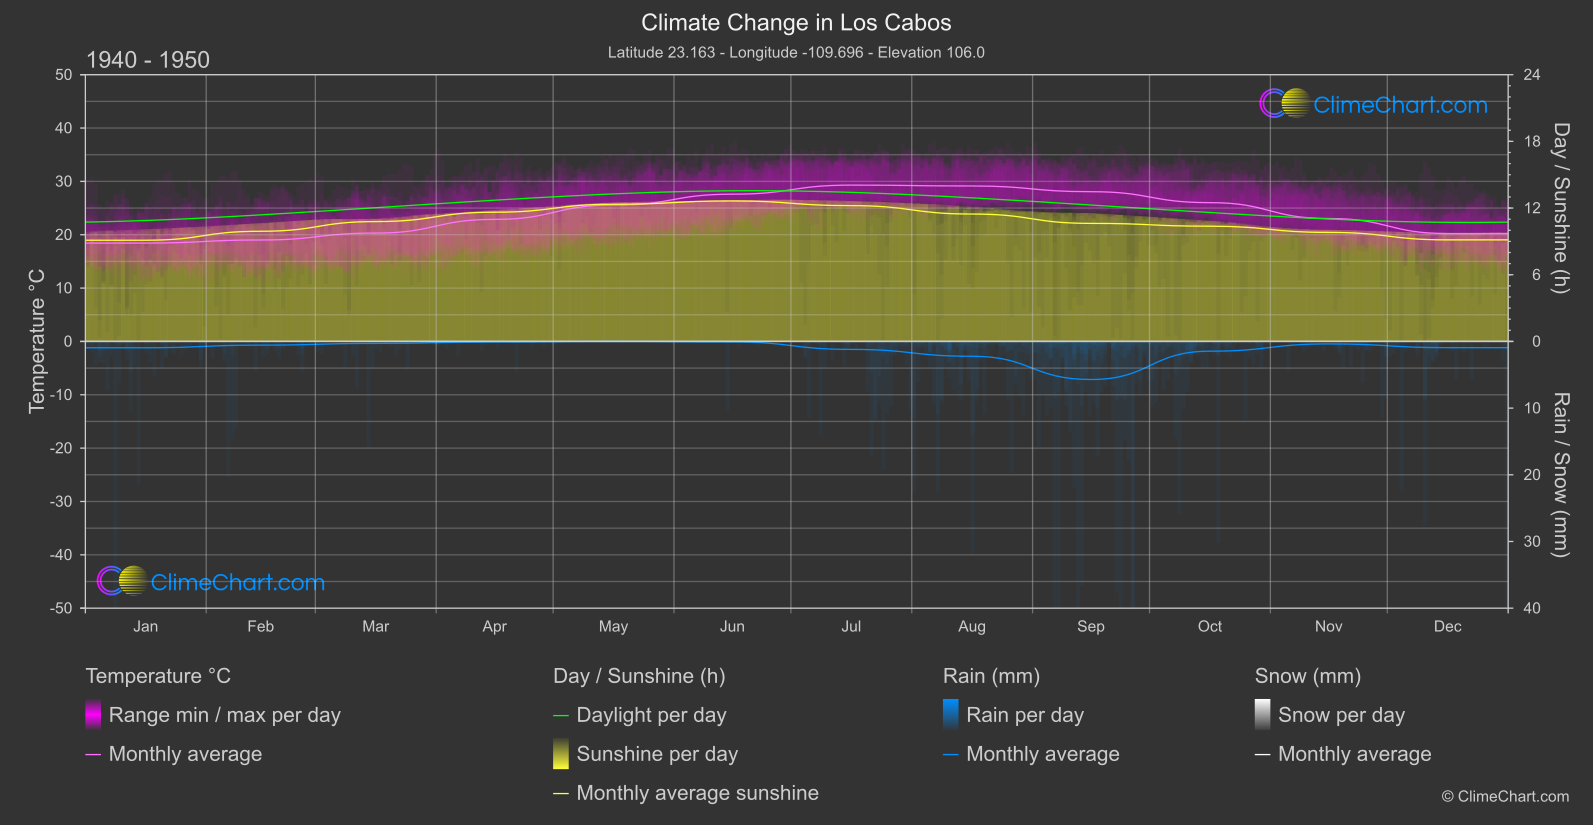
Los Cabos, Mexico, experiences significant changes in climate parameters over the years. According to the data, the month with the highest temperature change is June, with an increase of 1.28°C from 1940-1950 to 2013-2024. On the other hand, August has seen a notable increase in rainfall, with a rise of 2.70 mm. The sunshine duration, however, shows a decrease in several months, notably in August with a decline of 0.52 hours.
Climate Change Data Overview for Los Cabos, Mexico
Explore the comprehensive climate change data for Los Cabos, Mexico. This detailed table provides valuable insights into temperature variations, precipitation levels, and seasonal changes influenced by climate change, helping you understand the unique weather patterns of this region.
Temperature °C
| Month | ⌀ 1940 - 1950 | ⌀ 2013 - 2023 | +/- |
|---|---|---|---|
| Jan | 18.44 | 19.79 | 1.35 |
| Feb | 19.01 | 20.40 | 1.39 |
| Mar | 20.31 | 22.47 | 2.16 |
| Apr | 22.87 | 24.45 | 1.58 |
| May | 25.55 | 26.41 | 0.85 |
| Jun | 27.60 | 28.88 | 1.28 |
| Jul | 29.30 | 30.16 | 0.85 |
| Aug | 29.14 | 29.25 | 0.11 |
| Sep | 28.07 | 27.83 | -0.24 |
| Oct | 26.02 | 26.99 | 0.97 |
| Nov | 23.04 | 23.99 | 0.95 |
| Dec | 20.22 | 20.67 | 0.45 |
| ⌀ Month | 24.13 | 25.11 | 0.98 |
Sunshine (h)
| Month | ⌀ 1940 - 1950 | ⌀ 2013 - 2023 | +/- |
|---|---|---|---|
| Jan | 9.11 | 9.42 | 0.31 |
| Feb | 9.91 | 10.11 | 0.20 |
| Mar | 10.78 | 10.87 | 0.08 |
| Apr | 11.63 | 11.51 | -0.12 |
| May | 12.34 | 12.10 | -0.24 |
| Jun | 12.64 | 12.37 | -0.27 |
| Jul | 12.22 | 12.10 | -0.11 |
| Aug | 11.46 | 10.94 | -0.52 |
| Sep | 10.62 | 10.39 | -0.23 |
| Oct | 10.37 | 10.25 | -0.12 |
| Nov | 9.81 | 9.49 | -0.32 |
| Dec | 9.14 | 9.26 | 0.13 |
| ⌀ Month | 10.84 | 10.74 | -0.10 |
Rain (mm)
| Month | ⌀ 1940 - 1950 | ⌀ 2013 - 2023 | +/- |
|---|---|---|---|
| Jan | 0.47 | 0.16 | -0.31 |
| Feb | 0.28 | 0.26 | -0.01 |
| Mar | 0.15 | 0.08 | -0.07 |
| Apr | 0.04 | 0.01 | -0.03 |
| May | 0.00 | 0.04 | 0.04 |
| Jun | 0.04 | 0.61 | 0.58 |
| Jul | 0.60 | 1.10 | 0.51 |
| Aug | 1.11 | 3.81 | 2.70 |
| Sep | 2.85 | 4.06 | 1.21 |
| Oct | 0.73 | 1.04 | 0.31 |
| Nov | 0.19 | 0.69 | 0.50 |
| Dec | 0.47 | 0.14 | -0.32 |
| ⌀ Month | 0.58 | 1.00 | 0.42 |
Snow (mm)
| Month | ⌀ 1940 - 1950 | ⌀ 2013 - 2023 | +/- |
|---|---|---|---|
| Jan | 0.00 | 0.00 | 0.00 |
| Feb | 0.00 | 0.00 | 0.00 |
| Mar | 0.00 | 0.00 | 0.00 |
| Apr | 0.00 | 0.00 | 0.00 |
| May | 0.00 | 0.00 | 0.00 |
| Jun | 0.00 | 0.00 | 0.00 |
| Jul | 0.00 | 0.00 | 0.00 |
| Aug | 0.00 | 0.00 | 0.00 |
| Sep | 0.00 | 0.00 | 0.00 |
| Oct | 0.00 | 0.00 | 0.00 |
| Nov | 0.00 | 0.00 | 0.00 |
| Dec | 0.00 | 0.00 | 0.00 |
| ⌀ Month | 0.00 | 0.00 | 0.00 |