Climate Chart of Liverpool, Great Britain
Comprehensive Climate Chart of Liverpool, Great Britain: Monthly Averages and Weather Trends
Welcome to Liverpool, United Kingdom of Great Britain and Northern Ireland! Discover the climate and weather of this vibrant city.
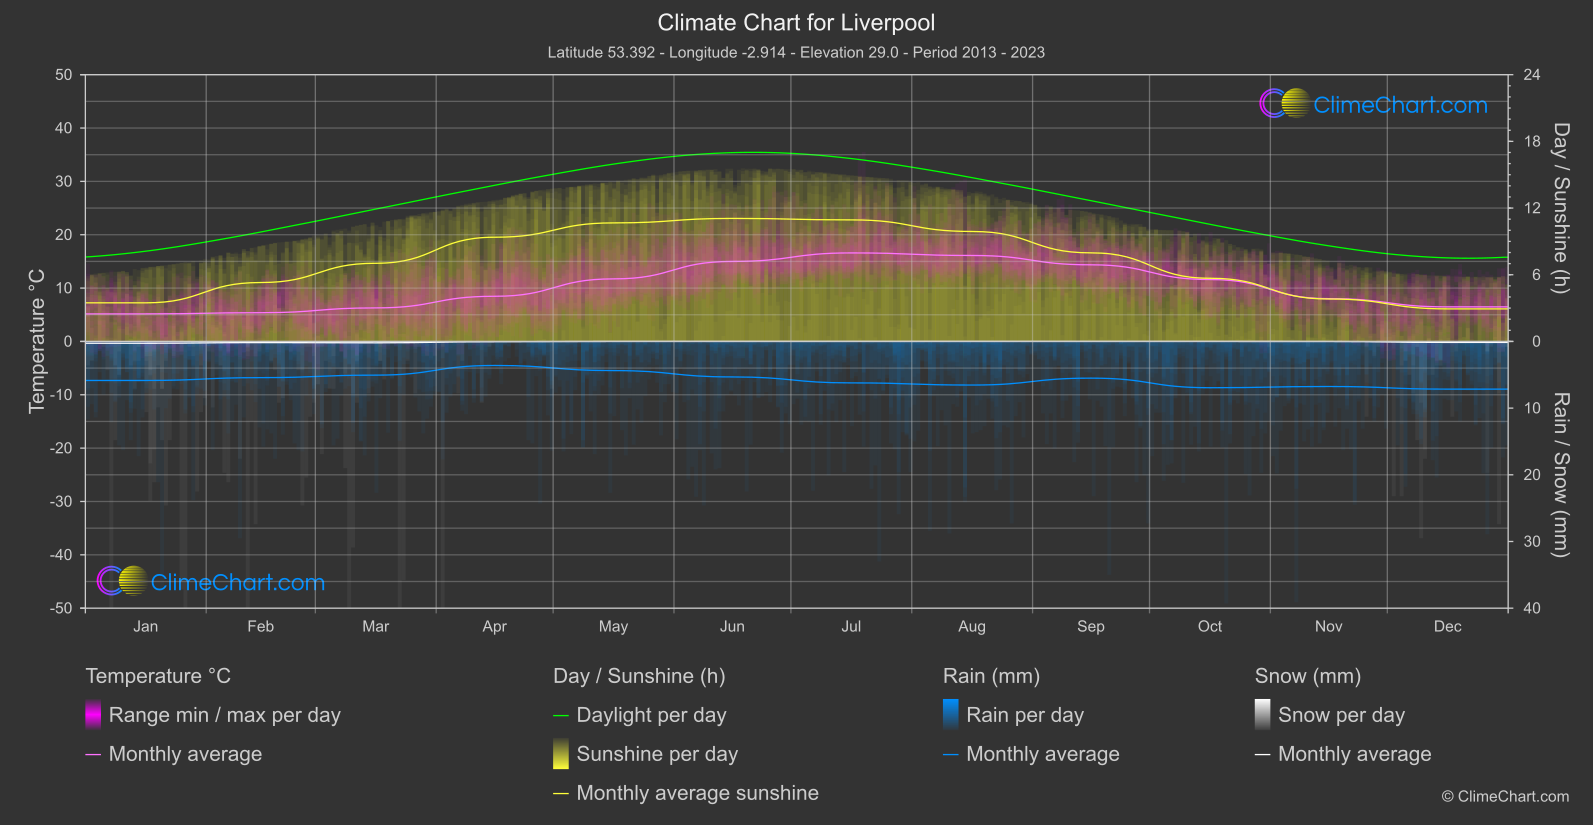
Liverpool experiences a temperate maritime climate with mild summers and cool winters. Rainfall is evenly distributed throughout the year, with slightly drier months in the summer. The city rarely sees extreme temperatures, making it a comfortable destination to visit at any time.
Best Travel Time Guide for Liverpool, Great Britain: Ideal Seasons and Weather Insights
The best time to visit Liverpool is during the summer months from June to August when the weather is pleasant for exploring the city's attractions and waterfront. Spring and autumn also offer mild temperatures ideal for sightseeing. Winter can be chilly but festive with Christmas markets and events.
Climate Data Overview for Liverpool, Great Britain
Explore the comprehensive climate data for Liverpool, Great Britain. This detailed table provides valuable insights into temperature variations, precipitation levels, and seasonal changes, helping you understand the unique weather patterns of this region.
| Month | ⌀ Temperature °C | ⌀ Rain (mm) | ⌀ Snow (mm) | ⌀ Sunshine (h) |
|---|---|---|---|---|
| Jan | 5.2 | 2.93 | 0.13 | 3.47 |
| Feb | 5.4 | 2.71 | 0.09 | 5.30 |
| Mar | 6.3 | 2.53 | 0.10 | 7.03 |
| Apr | 8.5 | 1.80 | 0.02 | 9.38 |
| May | 11.7 | 2.19 | 0.00 | 10.67 |
| Jun | 15.0 | 2.66 | 0.00 | 11.07 |
| Jul | 16.6 | 3.11 | 0.00 | 10.94 |
| Aug | 16.1 | 3.27 | 0.00 | 9.89 |
| Sep | 14.4 | 2.75 | 0.00 | 7.97 |
| Oct | 11.6 | 3.47 | 0.00 | 5.68 |
| Nov | 8.0 | 3.38 | 0.00 | 3.82 |
| Dec | 6.5 | 3.58 | 0.07 | 2.93 |
| ⌀ Month | 10.4 | 2.87 | 0.03 | 7.35 |