Climate Change Chart of Liverpool, Great Britain
Comprehensive Climate Change Chart of Liverpool, Great Britain: Monthly Averages and Impact Trends
Explore the changing climate in Liverpool, United Kingdom, through detailed data analysis.
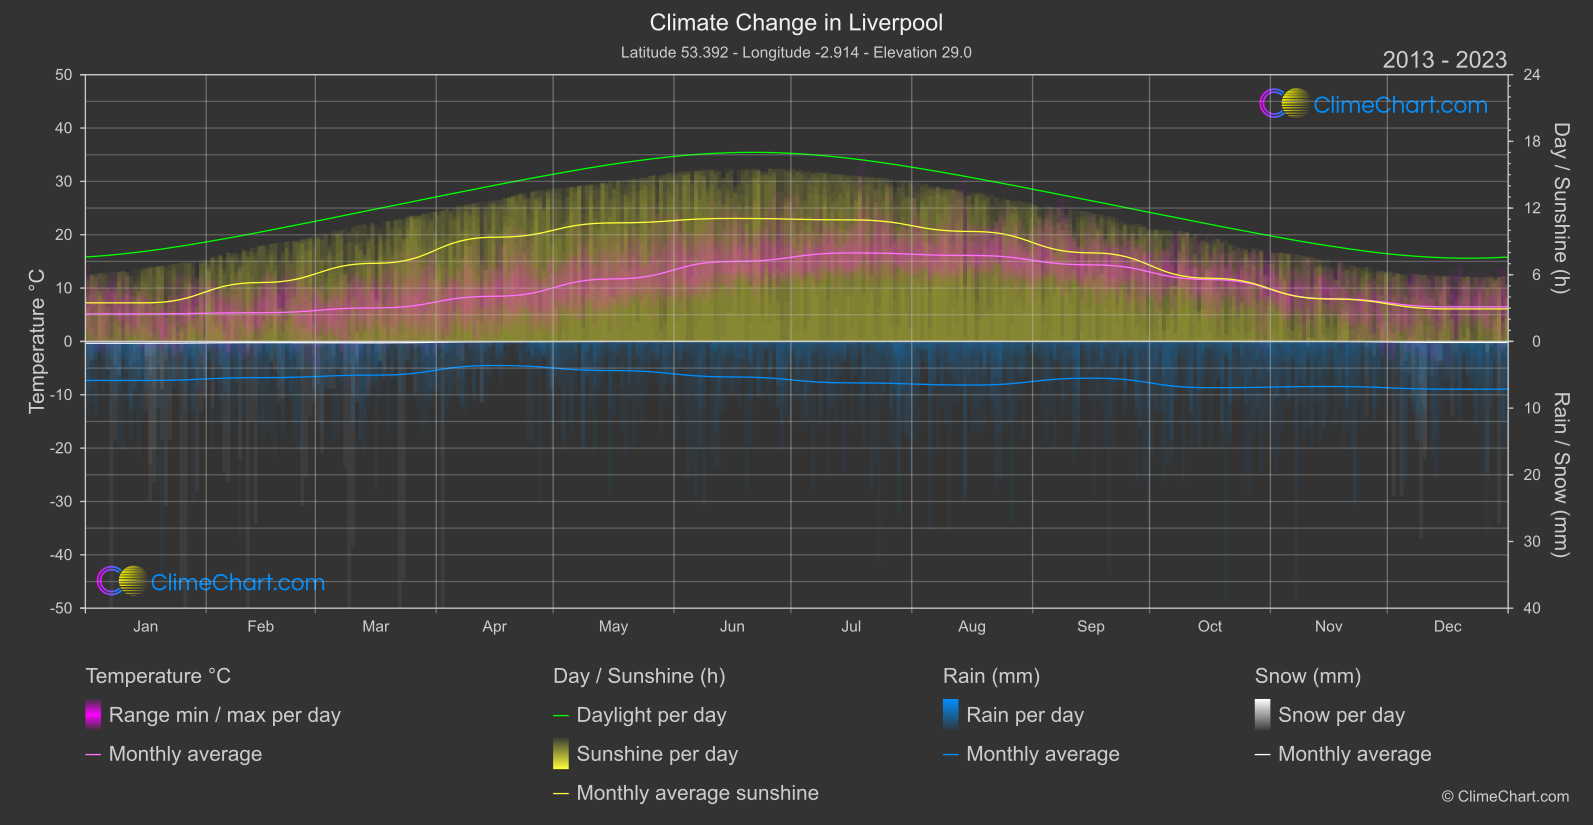
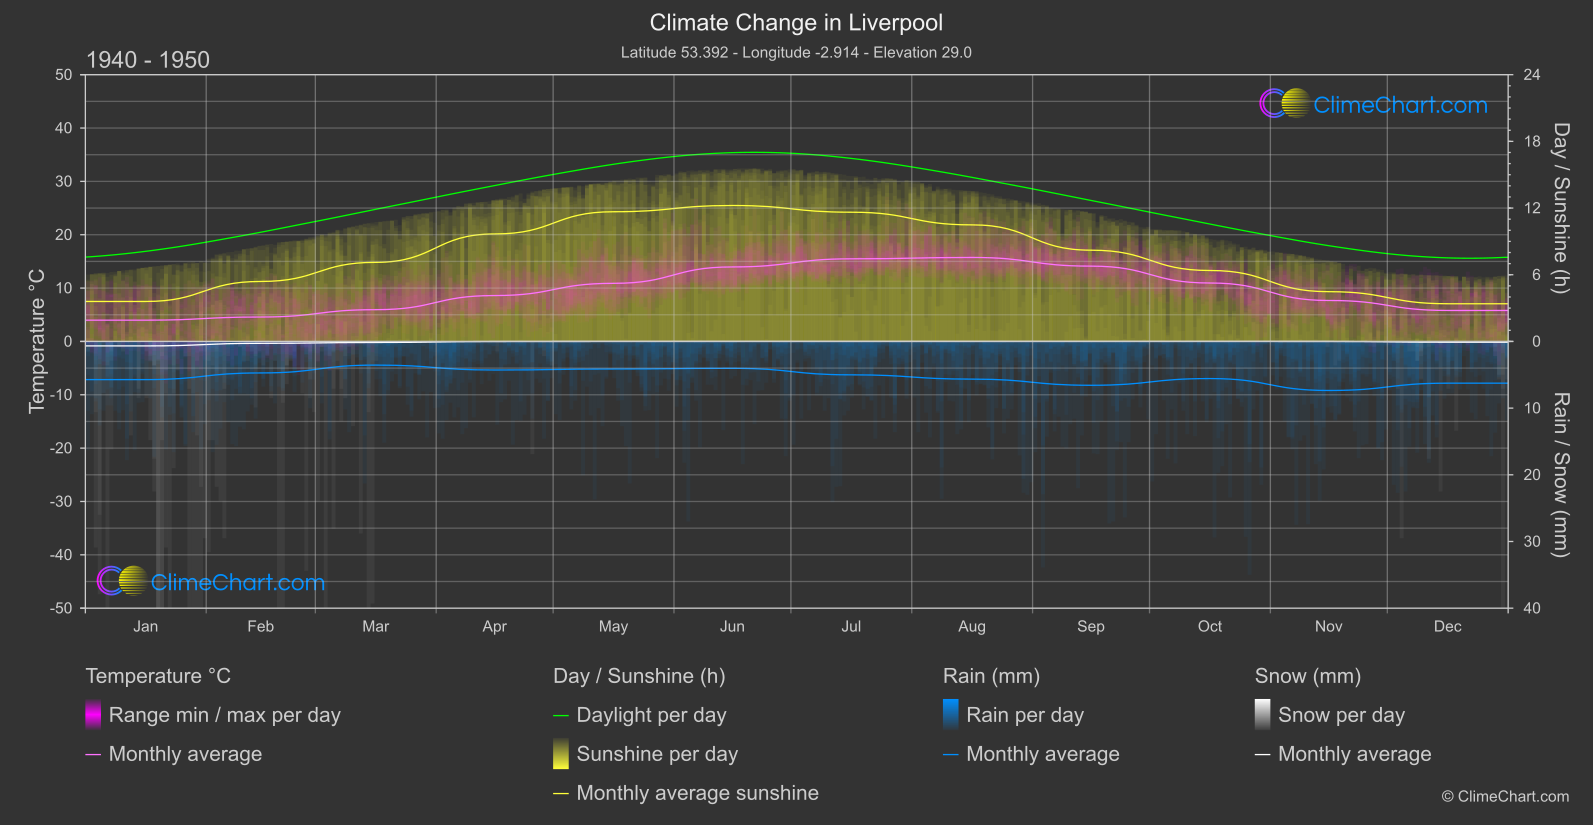
Liverpool, a city in the United Kingdom known for its maritime history and cultural heritage, has been experiencing noticeable changes in its climate over the years. Analyzing the temperature, rainfall, snowfall, and sunshine duration data from the periods of 1940-1950 and 2013-2024 provides valuable insights into the climate trends in Liverpool. From the data, it is evident that there have been significant increases in temperatures across various months, with some months experiencing more pronounced changes compared to others. The data also shows fluctuations in rainfall patterns, snowfall occurrences, and sunshine duration, indicating a shift in Liverpool's weather patterns over time.
Climate Change Data Overview for Liverpool, Great Britain
Explore the comprehensive climate change data for Liverpool, Great Britain. This detailed table provides valuable insights into temperature variations, precipitation levels, and seasonal changes influenced by climate change, helping you understand the unique weather patterns of this region.
Temperature °C
| Month | ⌀ 1940 - 1950 | ⌀ 2013 - 2023 | +/- |
|---|---|---|---|
| Jan | 3.98 | 5.16 | 1.18 |
| Feb | 4.58 | 5.38 | 0.81 |
| Mar | 5.95 | 6.29 | 0.33 |
| Apr | 8.60 | 8.46 | -0.14 |
| May | 10.89 | 11.72 | 0.83 |
| Jun | 13.96 | 15.00 | 1.03 |
| Jul | 15.48 | 16.59 | 1.11 |
| Aug | 15.74 | 16.11 | 0.37 |
| Sep | 14.11 | 14.36 | 0.25 |
| Oct | 10.95 | 11.60 | 0.65 |
| Nov | 7.67 | 8.02 | 0.35 |
| Dec | 5.81 | 6.48 | 0.67 |
| ⌀ Month | 9.81 | 10.43 | 0.62 |
Sunshine (h)
| Month | ⌀ 1940 - 1950 | ⌀ 2013 - 2023 | +/- |
|---|---|---|---|
| Jan | 3.60 | 3.47 | -0.12 |
| Feb | 5.40 | 5.30 | -0.10 |
| Mar | 7.12 | 7.03 | -0.08 |
| Apr | 9.67 | 9.38 | -0.29 |
| May | 11.67 | 10.67 | -1.00 |
| Jun | 12.23 | 11.07 | -1.16 |
| Jul | 11.63 | 10.94 | -0.69 |
| Aug | 10.49 | 9.89 | -0.59 |
| Sep | 8.21 | 7.97 | -0.24 |
| Oct | 6.38 | 5.68 | -0.70 |
| Nov | 4.48 | 3.82 | -0.66 |
| Dec | 3.39 | 2.93 | -0.46 |
| ⌀ Month | 7.85 | 7.35 | -0.51 |
Rain (mm)
| Month | ⌀ 1940 - 1950 | ⌀ 2013 - 2023 | +/- |
|---|---|---|---|
| Jan | 2.86 | 2.93 | 0.06 |
| Feb | 2.36 | 2.71 | 0.35 |
| Mar | 1.78 | 2.53 | 0.75 |
| Apr | 2.14 | 1.80 | -0.34 |
| May | 2.07 | 2.19 | 0.12 |
| Jun | 2.02 | 2.66 | 0.65 |
| Jul | 2.50 | 3.11 | 0.60 |
| Aug | 2.83 | 3.27 | 0.44 |
| Sep | 3.29 | 2.75 | -0.54 |
| Oct | 2.78 | 3.47 | 0.69 |
| Nov | 3.68 | 3.38 | -0.30 |
| Dec | 3.13 | 3.58 | 0.45 |
| ⌀ Month | 2.62 | 2.86 | 0.25 |
Snow (mm)
| Month | ⌀ 1940 - 1950 | ⌀ 2013 - 2023 | +/- |
|---|---|---|---|
| Jan | 0.34 | 0.13 | -0.20 |
| Feb | 0.14 | 0.09 | -0.05 |
| Mar | 0.08 | 0.10 | 0.03 |
| Apr | 0.01 | 0.02 | 0.01 |
| May | 0.00 | 0.00 | 0.00 |
| Jun | 0.00 | 0.00 | 0.00 |
| Jul | 0.00 | 0.00 | 0.00 |
| Aug | 0.00 | 0.00 | 0.00 |
| Sep | 0.00 | 0.00 | 0.00 |
| Oct | 0.00 | 0.00 | 0.00 |
| Nov | 0.00 | 0.00 | 0.00 |
| Dec | 0.06 | 0.07 | 0.01 |
| ⌀ Month | 0.05 | 0.04 | -0.02 |