Climate Chart of Langkawi, Malaysia
Comprehensive Climate Chart of Langkawi, Malaysia: Monthly Averages and Weather Trends
Explore the tropical paradise of Langkawi, Malaysia where sunny skies, sandy beaches, and lush rainforests await.
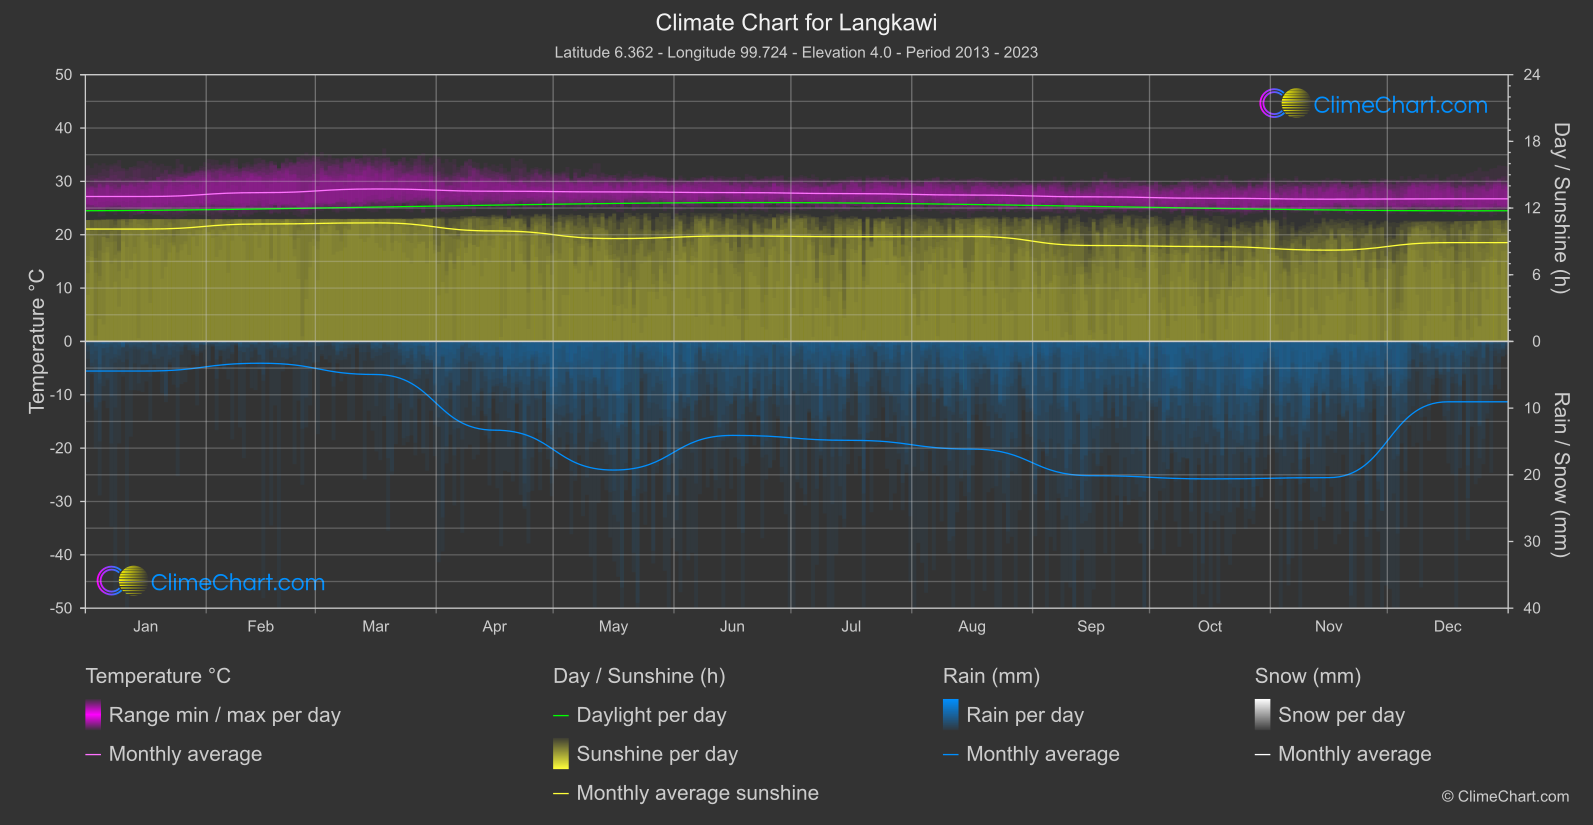
Langkawi enjoys a tropical climate with consistent temperatures averaging around 30°C throughout the year. The island experiences two main seasons - the dry season from November to March and the wet season from April to October. The wet season brings occasional heavy rainfall but is also a great time to witness the lush greenery of the island.
Best Travel Time Guide for Langkawi, Malaysia: Ideal Seasons and Weather Insights
The best time to travel to Langkawi is during the dry season from November to March when the weather is sunny and ideal for outdoor activities. However, visiting during the wet season from April to October offers a unique experience of witnessing the lush green landscapes after rainfall.
Climate Data Overview for Langkawi, Malaysia
Explore the comprehensive climate data for Langkawi, Malaysia. This detailed table provides valuable insights into temperature variations, precipitation levels, and seasonal changes, helping you understand the unique weather patterns of this region.
| Month | ⌀ Temperature °C | ⌀ Rain (mm) | ⌀ Snow (mm) | ⌀ Sunshine (h) |
|---|---|---|---|---|
| Jan | 27.2 | 2.22 | 0.00 | 10.11 |
| Feb | 27.9 | 1.63 | 0.00 | 10.57 |
| Mar | 28.6 | 2.48 | 0.00 | 10.67 |
| Apr | 28.2 | 6.65 | 0.00 | 9.94 |
| May | 28.0 | 9.64 | 0.00 | 9.26 |
| Jun | 27.9 | 7.05 | 0.00 | 9.49 |
| Jul | 27.7 | 7.42 | 0.00 | 9.43 |
| Aug | 27.4 | 8.07 | 0.00 | 9.44 |
| Sep | 27.1 | 10.07 | 0.00 | 8.63 |
| Oct | 26.8 | 10.31 | 0.00 | 8.54 |
| Nov | 26.7 | 10.21 | 0.00 | 8.21 |
| Dec | 26.7 | 4.53 | 0.00 | 8.89 |
| ⌀ Month | 27.5 | 6.69 | 0.00 | 9.43 |