Climate Change Chart of Langkawi, Malaysia
Comprehensive Climate Change Chart of Langkawi, Malaysia: Monthly Averages and Impact Trends
Explore the changing climate in Langkawi, Malaysia through historical data analysis. Discover insights on temperature, rainfall, and sunshine duration trends.
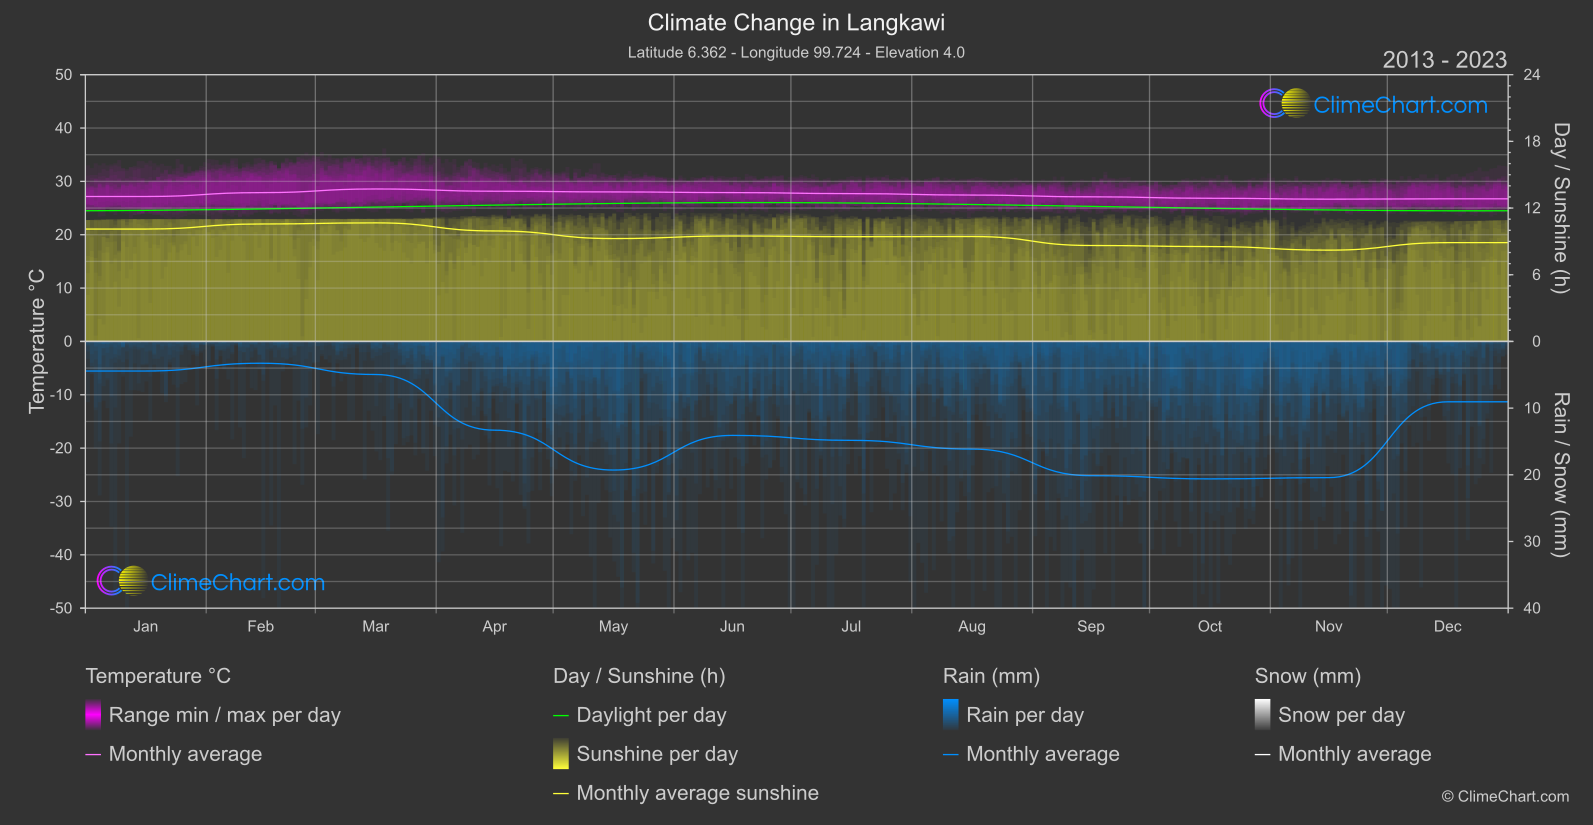
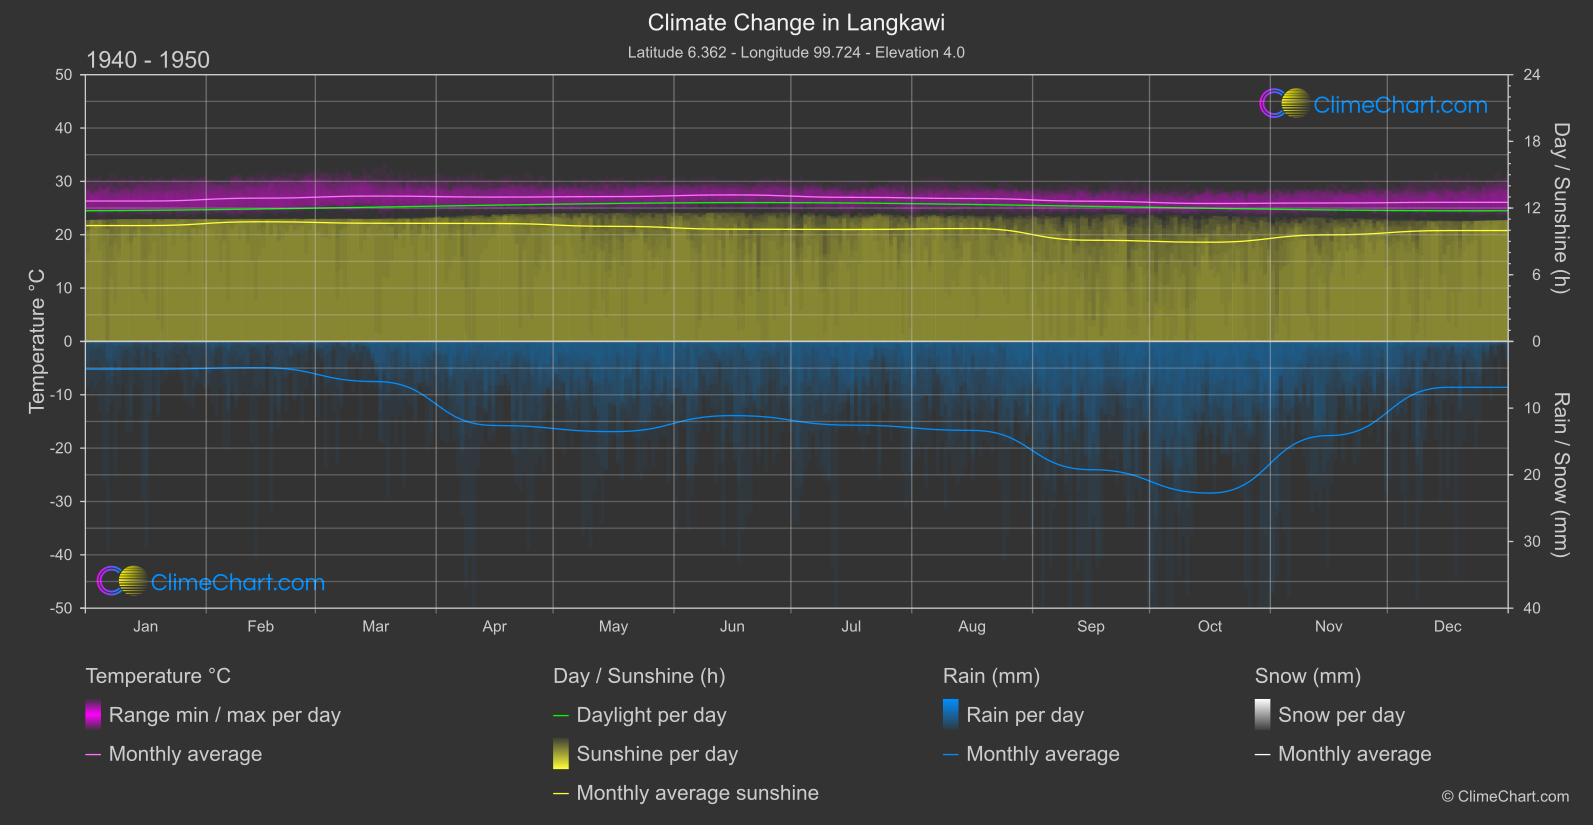
Langkawi, Malaysia, experiences notable changes in temperature, rainfall, and sunshine duration over the years. From January to December, data comparison between 1940-1950 and 2013-2024 shows varying degrees of shifts in climate patterns. Notably, May shows a significant increase in rainfall, while November experiences a notable rise in sunshine duration. Understanding these climate variations is crucial for better environmental planning and adaptation strategies.
Climate Change Data Overview for Langkawi, Malaysia
Explore the comprehensive climate change data for Langkawi, Malaysia. This detailed table provides valuable insights into temperature variations, precipitation levels, and seasonal changes influenced by climate change, helping you understand the unique weather patterns of this region.
Temperature °C
| Month | ⌀ 1940 - 1950 | ⌀ 2013 - 2023 | +/- |
|---|---|---|---|
| Jan | 26.32 | 27.17 | 0.85 |
| Feb | 26.86 | 27.89 | 1.03 |
| Mar | 27.25 | 28.58 | 1.33 |
| Apr | 27.06 | 28.16 | 1.10 |
| May | 27.15 | 28.02 | 0.87 |
| Jun | 27.46 | 27.90 | 0.43 |
| Jul | 27.01 | 27.70 | 0.69 |
| Aug | 26.79 | 27.44 | 0.65 |
| Sep | 26.29 | 27.11 | 0.82 |
| Oct | 25.86 | 26.83 | 0.98 |
| Nov | 25.95 | 26.67 | 0.72 |
| Dec | 26.08 | 26.73 | 0.66 |
| ⌀ Month | 26.67 | 27.52 | 0.84 |
Sunshine (h)
| Month | ⌀ 1940 - 1950 | ⌀ 2013 - 2023 | +/- |
|---|---|---|---|
| Jan | 10.42 | 10.11 | -0.31 |
| Feb | 10.77 | 10.57 | -0.20 |
| Mar | 10.63 | 10.67 | 0.03 |
| Apr | 10.61 | 9.94 | -0.67 |
| May | 10.35 | 9.26 | -1.10 |
| Jun | 10.10 | 9.49 | -0.61 |
| Jul | 10.07 | 9.43 | -0.65 |
| Aug | 10.16 | 9.44 | -0.72 |
| Sep | 9.10 | 8.63 | -0.47 |
| Oct | 8.93 | 8.54 | -0.39 |
| Nov | 9.59 | 8.21 | -1.38 |
| Dec | 9.97 | 8.89 | -1.09 |
| ⌀ Month | 10.06 | 9.43 | -0.63 |
Rain (mm)
| Month | ⌀ 1940 - 1950 | ⌀ 2013 - 2023 | +/- |
|---|---|---|---|
| Jan | 2.08 | 2.22 | 0.13 |
| Feb | 1.97 | 1.63 | -0.33 |
| Mar | 3.01 | 2.48 | -0.53 |
| Apr | 6.30 | 6.65 | 0.35 |
| May | 6.76 | 9.64 | 2.88 |
| Jun | 5.56 | 7.05 | 1.49 |
| Jul | 6.28 | 7.42 | 1.14 |
| Aug | 6.67 | 8.07 | 1.40 |
| Sep | 9.61 | 10.07 | 0.45 |
| Oct | 11.37 | 10.31 | -1.07 |
| Nov | 7.06 | 10.21 | 3.15 |
| Dec | 3.44 | 4.53 | 1.09 |
| ⌀ Month | 5.84 | 6.69 | 0.85 |
Snow (mm)
| Month | ⌀ 1940 - 1950 | ⌀ 2013 - 2023 | +/- |
|---|---|---|---|
| Jan | 0.00 | 0.00 | 0.00 |
| Feb | 0.00 | 0.00 | 0.00 |
| Mar | 0.00 | 0.00 | 0.00 |
| Apr | 0.00 | 0.00 | 0.00 |
| May | 0.00 | 0.00 | 0.00 |
| Jun | 0.00 | 0.00 | 0.00 |
| Jul | 0.00 | 0.00 | 0.00 |
| Aug | 0.00 | 0.00 | 0.00 |
| Sep | 0.00 | 0.00 | 0.00 |
| Oct | 0.00 | 0.00 | 0.00 |
| Nov | 0.00 | 0.00 | 0.00 |
| Dec | 0.00 | 0.00 | 0.00 |
| ⌀ Month | 0.00 | 0.00 | 0.00 |