Climate Chart of La Paz, Bolivia
Comprehensive Climate Chart of La Paz, Bolivia: Monthly Averages and Weather Trends
Welcome to the climate guide for La Paz, Bolivia!
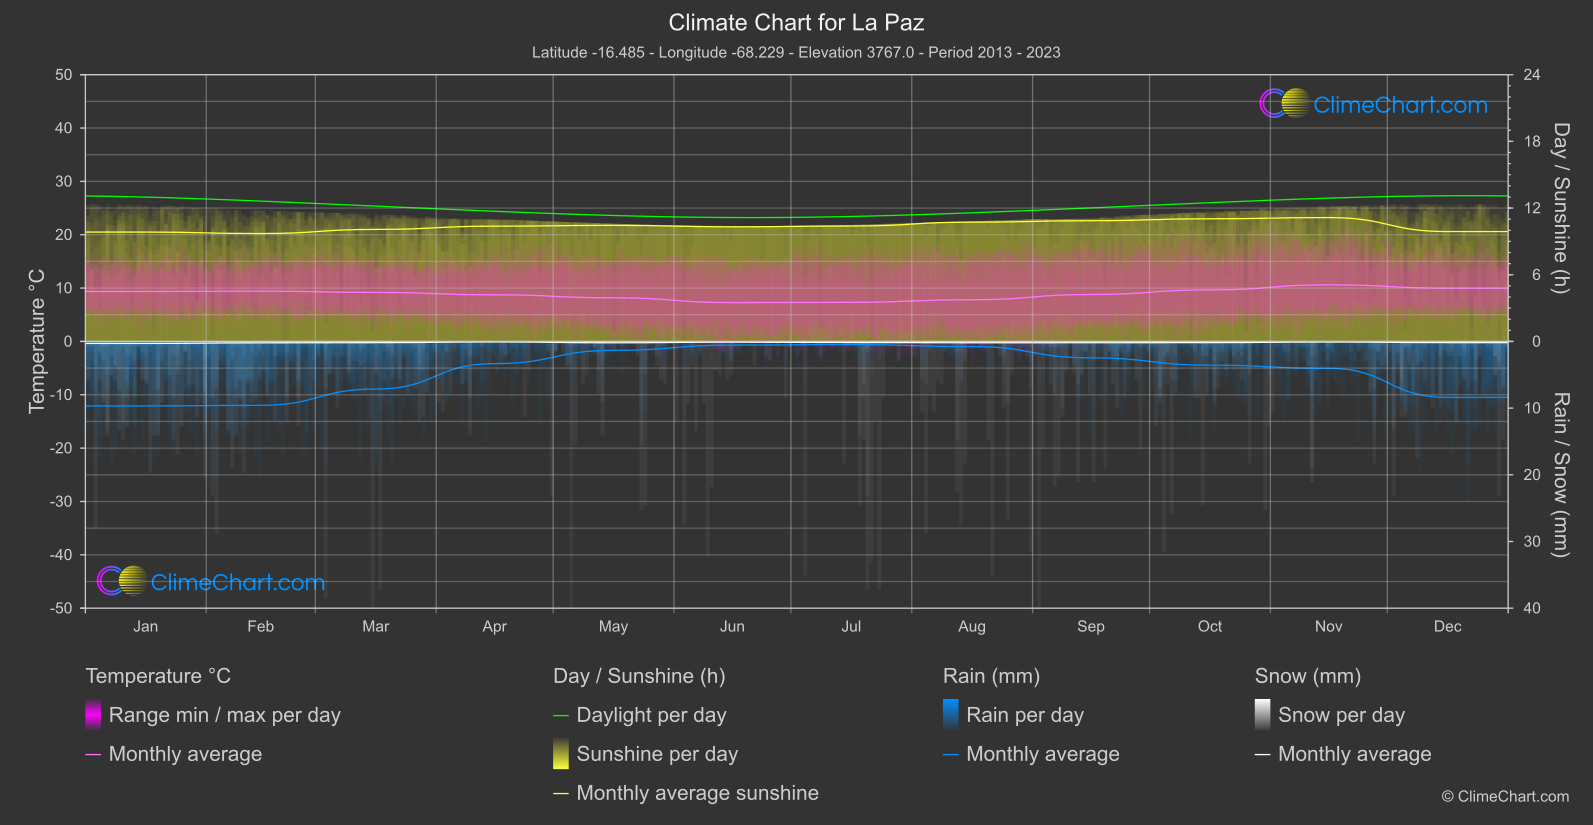
La Paz, the administrative capital of Bolivia, has a subtropical highland climate with distinct wet and dry seasons. The average annual temperature is around 10°C (50°F), with temperatures varying due to the city's high altitude. Rainfall is heaviest from December to February, while the dry season runs from May to October. Visitors should be prepared for cool temperatures and rapid weather changes when exploring this vibrant city.
Best Travel Time Guide for La Paz, Bolivia: Ideal Seasons and Weather Insights
The best time to travel to La Paz, Bolivia, is during the dry season from May to October when the weather is mild and pleasant. This period offers clear skies and ideal conditions for exploring the city's attractions and outdoor activities. While the wet season from December to February can bring heavy rainfall, it also provides a lush green landscape for nature enthusiasts to enjoy. Visitors should pack layers to accommodate the temperature variations and be prepared for occasional rain showers throughout the year.
Climate Data Overview for La Paz, Bolivia
Explore the comprehensive climate data for La Paz, Bolivia. This detailed table provides valuable insights into temperature variations, precipitation levels, and seasonal changes, helping you understand the unique weather patterns of this region.
| Month | ⌀ Temperature °C | ⌀ Rain (mm) | ⌀ Snow (mm) | ⌀ Sunshine (h) |
|---|---|---|---|---|
| Jan | 9.4 | 4.84 | 0.15 | 9.84 |
| Feb | 9.4 | 4.79 | 0.10 | 9.71 |
| Mar | 9.2 | 3.57 | 0.09 | 10.08 |
| Apr | 8.7 | 1.66 | 0.04 | 10.37 |
| May | 8.2 | 0.67 | 0.10 | 10.44 |
| Jun | 7.3 | 0.27 | 0.05 | 10.31 |
| Jul | 7.3 | 0.24 | 0.08 | 10.38 |
| Aug | 7.8 | 0.39 | 0.10 | 10.73 |
| Sep | 8.8 | 1.23 | 0.10 | 10.86 |
| Oct | 9.7 | 1.78 | 0.09 | 11.03 |
| Nov | 10.6 | 2.02 | 0.04 | 11.14 |
| Dec | 10.0 | 4.20 | 0.09 | 9.88 |
| ⌀ Month | 8.9 | 2.14 | 0.09 | 10.40 |