Climate Change Chart of La Paz, Bolivia
Comprehensive Climate Change Chart of La Paz, Bolivia: Monthly Averages and Impact Trends
Exploring the changing climate in La Paz, Bolivia
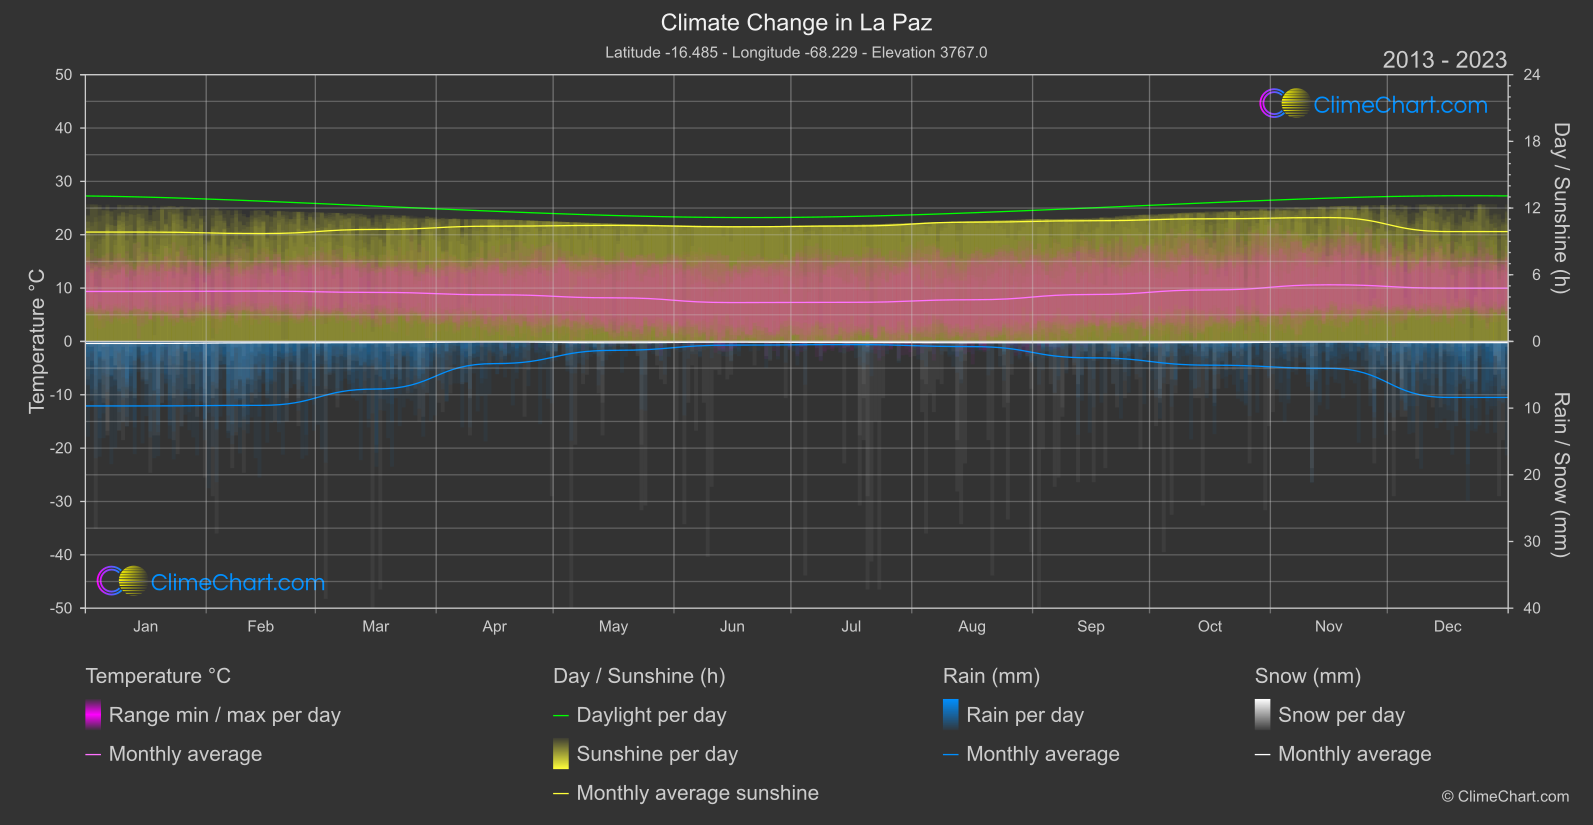
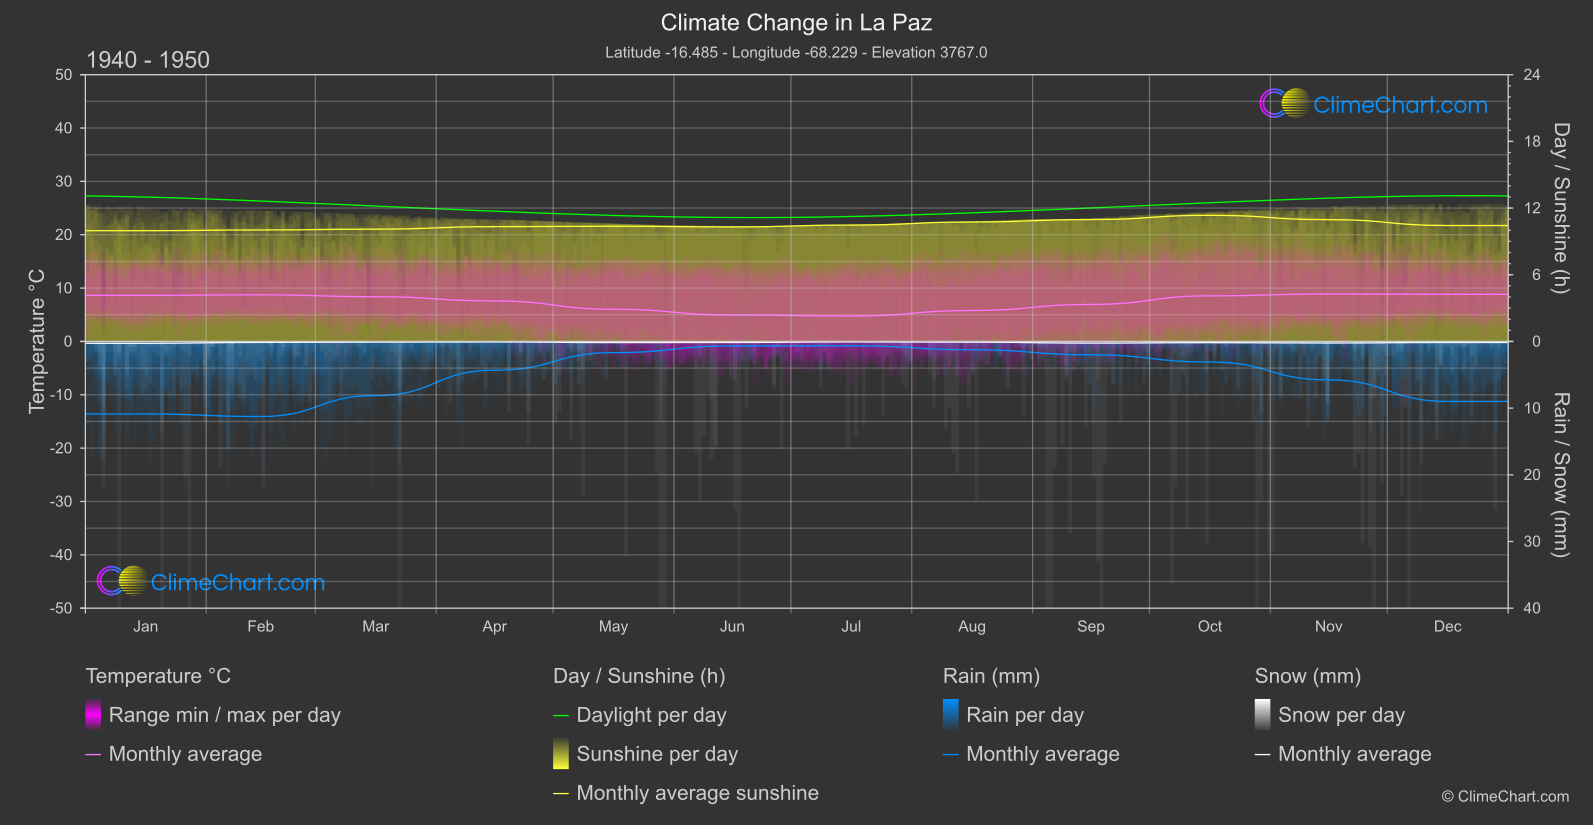
La Paz, Bolivia, is experiencing significant changes in temperature, rainfall, snowfall, and sunshine duration. Analysis of the data reveals that May has shown the highest increase in temperature over the years, while November has witnessed the most notable decrease in rainfall. These shifts in climate indicators reflect the ongoing impact of climate change in the region.
Climate Change Data Overview for La Paz, Bolivia
Explore the comprehensive climate change data for La Paz, Bolivia. This detailed table provides valuable insights into temperature variations, precipitation levels, and seasonal changes influenced by climate change, helping you understand the unique weather patterns of this region.
Temperature °C
| Month | ⌀ 1940 - 1950 | ⌀ 2013 - 2023 | +/- |
|---|---|---|---|
| Jan | 8.63 | 9.37 | 0.73 |
| Feb | 8.74 | 9.43 | 0.69 |
| Mar | 8.38 | 9.19 | 0.80 |
| Apr | 7.59 | 8.74 | 1.15 |
| May | 6.03 | 8.18 | 2.15 |
| Jun | 4.96 | 7.28 | 2.33 |
| Jul | 4.76 | 7.33 | 2.58 |
| Aug | 5.79 | 7.81 | 2.02 |
| Sep | 6.94 | 8.80 | 1.86 |
| Oct | 8.54 | 9.65 | 1.11 |
| Nov | 8.89 | 10.62 | 1.72 |
| Dec | 8.83 | 9.98 | 1.16 |
| ⌀ Month | 7.34 | 8.87 | 1.53 |
Sunshine (h)
| Month | ⌀ 1940 - 1950 | ⌀ 2013 - 2023 | +/- |
|---|---|---|---|
| Jan | 9.96 | 9.84 | -0.12 |
| Feb | 10.03 | 9.71 | -0.32 |
| Mar | 10.10 | 10.08 | -0.02 |
| Apr | 10.33 | 10.37 | 0.04 |
| May | 10.36 | 10.44 | 0.08 |
| Jun | 10.30 | 10.31 | 0.01 |
| Jul | 10.47 | 10.38 | -0.09 |
| Aug | 10.74 | 10.73 | -0.01 |
| Sep | 10.97 | 10.86 | -0.11 |
| Oct | 11.35 | 11.03 | -0.31 |
| Nov | 10.96 | 11.14 | 0.19 |
| Dec | 10.43 | 9.88 | -0.55 |
| ⌀ Month | 10.50 | 10.40 | -0.10 |
Rain (mm)
| Month | ⌀ 1940 - 1950 | ⌀ 2013 - 2023 | +/- |
|---|---|---|---|
| Jan | 5.44 | 4.84 | -0.60 |
| Feb | 5.63 | 4.79 | -0.84 |
| Mar | 4.06 | 3.57 | -0.49 |
| Apr | 2.16 | 1.66 | -0.49 |
| May | 0.84 | 0.67 | -0.17 |
| Jun | 0.34 | 0.27 | -0.06 |
| Jul | 0.32 | 0.24 | -0.09 |
| Aug | 0.62 | 0.39 | -0.23 |
| Sep | 1.00 | 1.23 | 0.23 |
| Oct | 1.54 | 1.78 | 0.24 |
| Nov | 2.88 | 2.02 | -0.87 |
| Dec | 4.50 | 4.20 | -0.30 |
| ⌀ Month | 2.44 | 2.14 | -0.31 |
Snow (mm)
| Month | ⌀ 1940 - 1950 | ⌀ 2013 - 2023 | +/- |
|---|---|---|---|
| Jan | 0.14 | 0.15 | 0.01 |
| Feb | 0.07 | 0.10 | 0.03 |
| Mar | 0.05 | 0.09 | 0.04 |
| Apr | 0.04 | 0.04 | -0.00 |
| May | 0.08 | 0.10 | 0.02 |
| Jun | 0.08 | 0.05 | -0.03 |
| Jul | 0.03 | 0.08 | 0.05 |
| Aug | 0.05 | 0.10 | 0.04 |
| Sep | 0.13 | 0.10 | -0.03 |
| Oct | 0.09 | 0.09 | -0.00 |
| Nov | 0.12 | 0.04 | -0.08 |
| Dec | 0.08 | 0.09 | 0.01 |
| ⌀ Month | 0.08 | 0.09 | 0.01 |