Climate Chart of Kuching, Malaysia
Comprehensive Climate Chart of Kuching, Malaysia: Monthly Averages and Weather Trends
Welcome to Kuching, Malaysia! Discover the climate and weather of this vibrant city.
Kuching, located in Sarawak, experiences a tropical rainforest climate with consistent temperatures and high humidity throughout the year. The city sees heavy rainfall, especially during the monsoon season from November to February. Expect warm temperatures averaging around 27-32°C (81-90°F) all year round, making it a great destination for those who enjoy tropical weather.
Best Travel Time Guide for Kuching, Malaysia: Ideal Seasons and Weather Insights
The best time to travel to Kuching is during the drier months from June to August when rainfall is lower, making it ideal for outdoor activities and sightseeing. However, if you prefer a lush green landscape, the rainy season from November to February offers a unique experience of the city's natural beauty in full bloom.
Climate Data Overview for Kuching, Malaysia
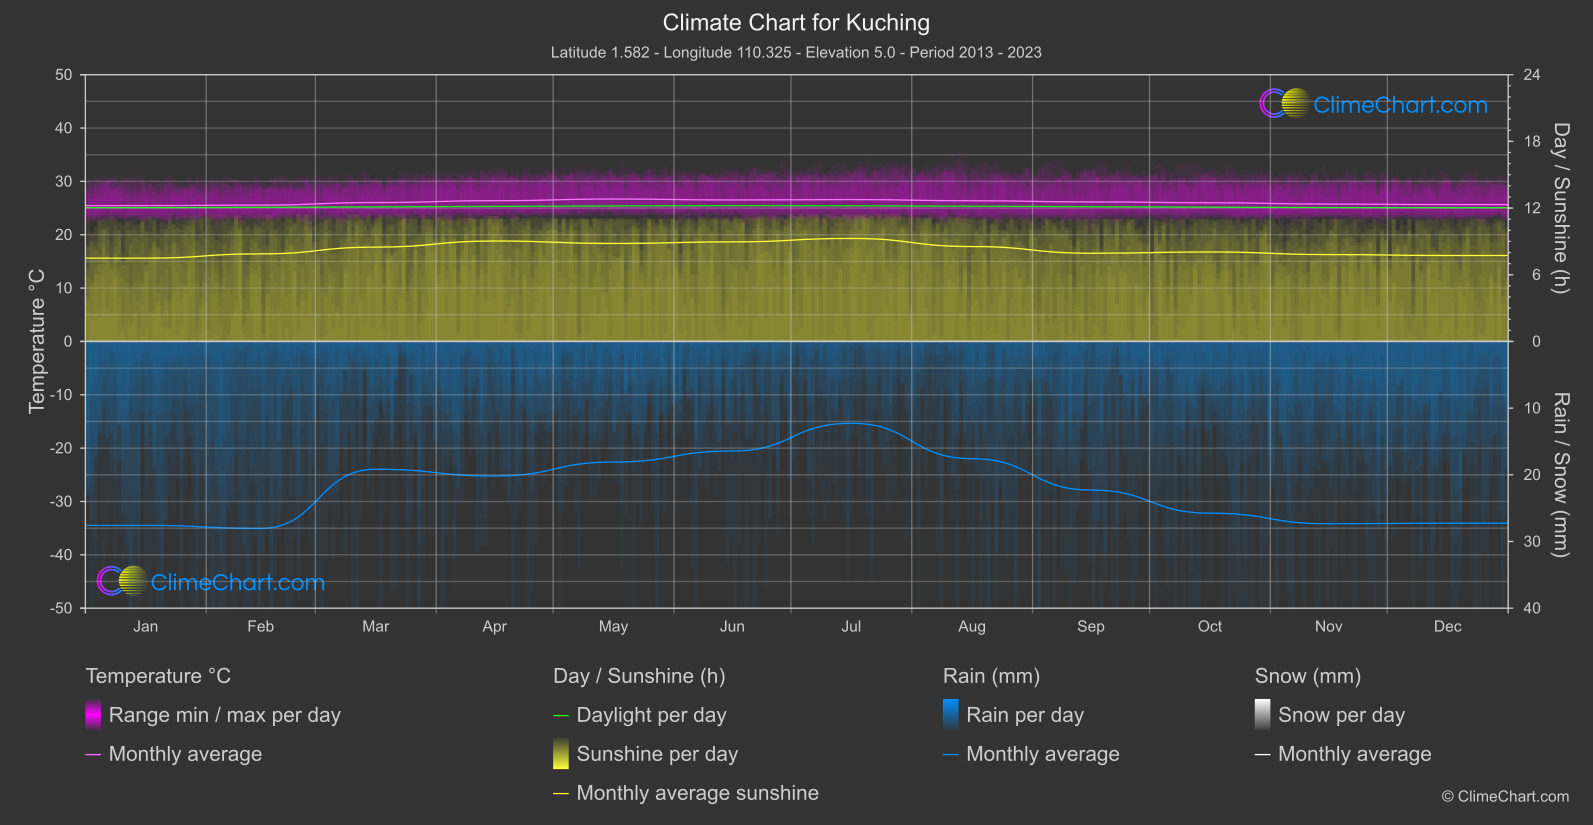
Explore the comprehensive climate data for Kuching, Malaysia. This detailed table provides valuable insights into temperature variations, precipitation levels, and seasonal changes, helping you understand the unique weather patterns of this region.
| Month | ⌀ Temperature °C | ⌀ Rain (mm) | ⌀ Snow (mm) | ⌀ Sunshine (h) |
|---|---|---|---|---|
| Jan | 25.5 | 13.79 | 0.00 | 7.49 |
| Feb | 25.6 | 14.02 | 0.00 | 7.88 |
| Mar | 26.0 | 9.58 | 0.00 | 8.49 |
| Apr | 26.4 | 10.09 | 0.00 | 9.03 |
| May | 26.7 | 9.04 | 0.00 | 8.82 |
| Jun | 26.5 | 8.22 | 0.00 | 8.96 |
| Jul | 26.6 | 6.14 | 0.00 | 9.27 |
| Aug | 26.4 | 8.79 | 0.00 | 8.54 |
| Sep | 26.2 | 11.14 | 0.00 | 7.93 |
| Oct | 26.0 | 12.88 | 0.00 | 8.05 |
| Nov | 25.7 | 13.67 | 0.00 | 7.81 |
| Dec | 25.6 | 13.63 | 0.00 | 7.73 |
| ⌀ Month | 26.1 | 10.92 | 0.00 | 8.33 |